Full Html
Full Html
1 | Introduction
In teacher education, field practice constitutes a pivotal component, serving as a bridge between theoretical knowledge and practical application (Caires & Almeida 2005). It also serving as a real-life arena, where skills are practiced and learned in their own right (Youngs et al., 2022). Across a wide array of European teacher education programs, field practice forms a significant portion of the time in the program, although cross-country differences exist (Oberhuemer, 2014; Weisdorf, 2020). Typically, professional education programs consist of multiple field practice placements in schools, where students practice core skills and engage in profession-specific reasoning that becomes more complex as they progress through their studies. Field practice placements offer student teachers unique opportunities to engage themselves in the real-life complexities of the classroom while learning to master teacher and teaching-related practices through observation, own practice and receiving feedback (Nielsen, 2021). It is in these authentic settings that the theoretical concepts learned through on-campus teaching are brought to life, allowing student teachers to not only apply and refine the core skills of their profession, but also to situate and deepen their understanding.
Research indicates that positive field practice experiences are essential in setting teachers on a successful professional trajectory. Rots et al. (2007) demonstrated that a teacher’s decision to remain in the profession hinges on initial commitment and the quality of early teaching experiences. They highlight the role of hands-on training in teacher education, emphasizing its significant impact on teachers quitting. Other work emphasizes the crucial role of field practice in mitigating the 'practice shock' often experienced by new teachers (Haugen & Hestbek, 2015). According to this account, field practice – although not always sufficiently realistic – provides vital insights into the challenging realities faced in school environments, such as a lack of time for preparation, parent collaboration, conflict management, and so on (Böwadt & Vaaben, 2021), as well as the need to be adaptable to the teaching context (Danmarks Evalueringsinstitut, 2022).
1.1. Academic self-efficacy
A key concept in education is academic self-efficacy (Bandura, 1997; Khine & Nielsen, 2022). Self-efficacy can be generally defined as "a belief in one's ability to plan and execute the necessary actions to achieve specific goals" (Bandura, 1997, p. 3). Academic self-efficacy has been defined in different ways and with different degrees of specificity. For example, part of the field (what we might refer to as the Schwartzer school of self-efficacy) has argued that the various and numerous cases of failure or success over time in different academic domains may lead to a more general sense of self-efficacy, referring to a global ability to master challenges which also cover education (e.g. Scholz et al., 2002; Schwarzer & Jerusalem, 1995). From this follows that academic self-efficacy does not need to be measured in itself. Another part of the field (i.e., the Bandura school of self-efficacy) has advocated that academic self-efficacy is task-specific and should be assessed against specific tasks in a specific context or against tasks in a somewhat broader domain to be termed specific self-efficacy (e.g. Bandura, 1997; Scherbaum et al., 2006). However, both schools of thought on self-efficacy agree that differing demands through education imply that one’s sense of academic self-efficacy might vary depending on the specific educational context and the point in time during the course of education (Nielsen, et al., 2017).
Academic self-efficacy in higher education has mainly been studied in relation to the academic content of education, and has, in meta-analyses, been found to be the strongest non-ability predictor of grades, above other non-ability constructs such as personality traits, motivation, and various learning strategies (Bartimote-Aufflick et al., 2015; Richardson et al., 2012). In addition, students who feel efficacious when learning or performing a task, participate more readily, work harder, persist longer when they encounter difficulties, and achieve at a higher level of academic performance (Schunk & Pajares, 2002). Research on academic self-efficacy in relation to field practice is less prominent, particularly research taking into account the special position of the student teachers as learners having to engage in teaching practices that they do not yet master, in order to learn and move towards becoming full-fledged teachers. In this situation, where students are learning professional skills while practicing them, their identity will invariably be split between being a student and a teacher (e.g., Anspal et al., 2018; Alsup, 2005). This highlights the need to attend to self-efficacy in relation to field practice taking into account this unique learner’s position in the relatively unsafe, psychologically, high-risk learning environment compared to the on-campus learning environment. During field practice the consequences of “failure” can extend to other people, i.e., the children and their parents, as well as “teacher colleagues”. The personal psychological risk is also higher in the field practice learning environment, compared to the on-campus environment, since student teachers face increased communicative, emotional, and psychological demands while learning (Anspal et al., 2018; Caries & Almeida, 2005). These circumstances of the field practice learning environment factors may contribute to student teachers doubting whether they have what it takes to engage in the profession’s core practices, i.e. affecting their self-efficacy for practice negatively (Nielsen et al., 2024).
1.2. Research on self-efficacy and field practice in teacher education
Previous research on student teachers’ self-efficacy in field practice has mainly been focused on examining the potential of field practice to foster teacher self-efficacy. Studies show that authentic classroom experiences, through school-based field practice, significantly enhance student teachers’ teacher self-efficacy (e.g. Klassen & Durksen 2014; Flores, 2015; Pfitzer-Eden 2016; Rupp & Becker 2020; Brown et al., 2021; Symes et al. 2023). For example, Klassen and Durksen (2014) tracked the self-efficacy of Canadian student teachers during an 8-week school-based field practicum. This period included weekly mentoring sessions and daily informal support from mentor teachers to help with planning and managing their teaching. Using only three items from the Teachers' Sense of Efficacy Scale (TSES; Tschannon-Moran & Woolfolk Hoy, 2001), they reported that student teachers’ teacher self-efficacy increased during their field practice, coupled with declining levels of stress.
However, it is difficult to assess how effective field practice is in fostering student teachers’ teacher self-efficacy or their instructional self-efficacy. While some studies report no or even negative effects (e.g., Savasci & Tuna 2018; Elstad & Christophersen 2017; Atay, 2007; Lin & Gorrell 2001; Pendergast et al., 2011), variations in study designs - such as setting (school-based vs. lab-based), support activities (feedback on lesson plans, lessons or modeling), target group (beginners or advanced students), length of field practice and educational programs across different countries - complicate comparisons. To address these differences, Mok et al. (2023) conducted a meta-analysis of 28 studies focusing on pre-service and beginning teachers. They reported a medium overall effect size on teacher self-efficacy, indicating a generally positive impact.
Previous studies have also suggested that receiving feedback on lesson planning (e.g. Mok et al. 2023) may amplify the positive impact of field experiences on teacher self-efficacy. In addition, the duration of the field experience contributes positively to its impact (Charles et al. 2023), whereas field practice seems to produce similar positive effects among beginner and advanced student teachers (Pfitzner-Eden 2016). Other research has linked shifts in self-efficacy during field practice to direct engagement with teaching activities (e.g. Martins et al. 2015; Flores 2015; Pfitzer-Eden 2016; Weber & Greiner 2019; Brown et al. 2021), observation of experienced teachers (e.g. Flores 2015; Pfitzer-Eden 2016), the opportunity to link theoretical knowledge to practice (e.g. McDonnough & Matkins 2010), and feedback from mentors, peers and students (e.g. Klassen & Durksen 2014; Flores 2015; Karaka? & Erten 2021).
1.3. What is missing?
Several studies have explored the constructs of teacher self-efficacy and instructional self-efficacy in the context of field practice. However, a significant limitation arises from their dependence on generic teacher self-efficacy measures, such as Teachers' Sense of Efficacy Scale (TSES) (Tschannen-Moran & Woolfolk Hoy, 2001), derivations thereof, or the Student Teachers’ Instructional Self-Efficacy in Technology-Rich Classrooms questionnaire (Elstad & Christophersen, 2017). The first is concerned with self-efficacy for teaching practices, but it was developed purely by experienced teachers and for use within this target group. Thus, while it contains three self-efficacy subscales: self-efficacy for instructional strategies, self-efficacy for classroom management, and self-efficacy for student engagement, these subscales were not intended for use with student teachers. The latter was indeed developed for student teachers. It only contains two 3-item scales concerned with self-efficacy: self-efficacy for maintaining discipline and self-efficacy for influencing students’ use of ICT in the service of learning, but both are concerned only with teaching practices related to the use of ICT. Thus, such measures fall short in capturing the unique beliefs and challenges experienced by student teachers during their field practice training. Typically, such studies frame questions within a general teaching context (e.g., “for teachers in their school context”), neglecting the unique and constrained context of student teachers’ experiences. Unlike professional teachers, who teach in an independent environment, student teachers’ experiences are likely confined to a controlled, learning-focused, and supervised setting (Cohen & Berlin, 2020). While the Instructional Self-Efficacy questionnaire does not suffer from this framing issue, it fails to tap into teaching practices not connected to the use of ICT.
This lack in specificity is critical. According to Bandura (1997), self-efficacy only has predictive power when it is evaluated against specific tasks in a specific context or domain. Pajares (1996) further emphasized that self-efficacy judgments need to be domain- and task-specific to be predictively relevant. When questions are specifically tailored to the context of field practice, they are more likely to draw out responses that genuinely reflect student teachers' perceptions of their abilities in that particular environment. In contrast, using a general teaching context may result in responses that, at best, inaccurately represent student teachers' self-efficacy, either overestimating or underestimating their perceived capabilities, or at worst, rather than relevant context-specific self-efficacy beliefs tap into a generalized personality trait (Pajares, 1996).
Despite the risk of misinterpretation inherent in using general measures among student teachers, there are currently no instruments specifically designed to measure student teachers' self-efficacy in field practice. This gap underscores the need for specialized, context-specific measurement tools that can accurately assess student teachers' self-efficacy, taking into account the unique challenges and tasks they encounter. A recent study by Nielsen and colleagues (2024) used focus groups and individual interviews with student teachers and their field practice teachers/mentors to identify 33 teacher and teaching-related practices that student teachers might doubt they have sufficient abilities and skills to engage in during field practice, i.e. that they might not feel efficacious towards.
1.3.1. The current study
The overall aim of the study was to fill this gap in the research on field practice-related self-efficacy in teacher education by developing a first and multi-dimensional instrument for the measurement of the various aspects of field practice self-efficacy for student teachers. This aim was fulfilled by:
- Collecting qualitative information on the teacher and teaching-related practices that student teachers might doubt they have the necessary abilities to engage in during field practice from a broad selection of teacher education stakeholders and formal curriculum sources, analyzing these data, and designing items based on the results.
- Collecting survey data with the developed instrument and conducting a first investigation of its psychometric properties using Rasch family Item Response Theory models, specifically considering local independence of items and differential item functioning relative to background variables that would plausibly be used in group comparison studies.
With regards to initial criterion validity, it was expected that teaching experience prior to commencing the teacher education program would be positively correlated to all sub-constructs.
2 | Method
2.1. Initial instrument development (stage 1)
2.1.1. Data collection and sources of information
To uncover a sufficiently broad and detailed basis of information for the development of the field practice self-efficacy instrument, we collected qualitative data on the teacher and teaching-related practices student teachers could have difficulty believing they have sufficient abilities and competencies to enact/engage in, while in field practice, from a multitude of stakeholders and sources of information. Thus, we conducted two focus-group interviews with a total of 12 first year student teachers prior to their first field practice placement in schools (six students in each focus group). Students were recruited by on-campus teachers from classes, which includes preparing and following students through field practice. The focus groups were gender balanced, as one group had 50% female students and the other had 67% female students. Students’ ages were not recorded. The students had a varied educational background: from entering teacher education directly from high school to having a previously completed bachelor’s degree. In the focus groups, students were prompted to talk about teaching and teaching-related tasks that they thought they would find difficult or not difficult to believe they could engage in, while in field practice. Interviewers had a simple semi-structured interview guide as a backup if needed but were instructed to try to refrain from giving examples, and if they did so, to only mention an obvious activity as the actual teaching Each focus group interview was approximately 45 minutes long. We also conducted four single-person interviews with field-practice teachers from schools where students would be placed in field practice at all levels of the teacher education program. Three of the field practice teachers were female, and their experience as teachers ranged from one to 38 years. The field practice teachers were prompted to talk about teaching and teaching-related tasks that they thought the student teachers found difficult or not difficult to believe they could engage in during field practice. Again, the interviewers were instructed to interfere with the respondents’ responses as little as possible, only prompting further with a simple example of an obvious teaching task. Each of these interviews was approximately 15 minutes long.
In addition to the interviews (above), we collected written information from four on-campus teachers in the first year of the teacher education program. The on-campus teachers were three female and one male teacher. Their ages ranged from 31 to 54 years. Three had an educational master’s degree on top of either the four-year teacher training program or a bachelor’s degree in educational science. The fourth campus teacher had a full bachelor and master’s degree in English language and history and a teaching degree on top. They had between two to 24 years of experience teaching in primary or secondary school and had six months to three years of experience teaching in the teacher education program. The on-campus teachers were asked to briefly list the teacher and teaching-related practices student teachers could have difficulty believing they have sufficient abilities and competencies to enact/engage in during field practice. A written account of the same was also elicited from a field practice coordinator, who was responsible for maintaining the pool of field practice schools, evaluating field practice with both students and field-practice teachers, and who thus had detailed knowledge of issues and insecurities. The field practice coordinator in question had ten years of experience in this role.
As the last source of information, we collected the national skills objectives for the field practice in the Danish teacher education programme (Act on the Education of Teachers of 2015). The objectives are included as Supplemental file 1 in an English translation.
2.1.2. Information extraction and content analyses
All interviews were recorded and transcribed. The interview data, the written accounts, and the skills objective document were analysed for the purpose of extracting all statements on teacher and teaching-related practices. The extracted statements were marked by source. The extracted statements were then subjected to content analysis, and statements with the same meaning were combined to form statements on unique practices.
To obtain systematic and easily interpretable knowledge on the overlap and discrepancies of teacher and teaching-related practices across the twelve sources of information, the unique practices were recorded in a data matrix linking practices to information source (coded 1, if practice was mentioned by a source and 0 if not). This matrix was then used to generate an innovative co-mention circle using an adapted-for-purpose version of the R code provided by Fried (2016; 2020). The data matrix for generating the co-mention circle is publicly available at Zenodo.org (https://doi.org/10.5281/zenodo.12788471).
The method for constructing the co-mention circle followed the approach outlined in Fried (2016; 2020), however, with two key adaptations in order to enhance functionality of the code. Firstly, Fried’s code, which utilized the data.table package (Dowle & Srinivasan 2023), was transitioned to the tidyverse package (v2.0.0; Wickham et al. 2019) to enhance clarity and readability of the code and make it more accessible to other users, as the tidyverse eco-system is well-documented and supported by a large, active community. Secondly, we introduced a new approach to determine the order of practices within the circle and across sources of information. Thus, practices were arranged anti-clockwise based on their frequency, starting with those most prevalent across sources and concluding with those mentioned by the fewest sources. In cases where practices shared equal frequency of co-occurrence, we applied a sorting criterion based on their presence in the outermost circle and moving inwards. In this way, we would first plot the practice with the highest frequency of co-occurrence, then the practice(s) with the second-highest co-occurrence, starting with the practice occurring most towards the outer rim of the co-mention circle, and so forth. In this manner, we achieved a co-mention circle with an inward-moving plotting of practices. The R code for the co-mention circle is publicly available at Zenodo.org (https://zenodo.org/doi/10.5281/zenodo.12788451).
2.1.3. Development of items and subscales
The statements on unique teacher and teaching practices were developed into items for the PSEQ questionnaire using a straightforward approach following the guidelines of Irwing and Hughes (2018). Thus, statements were condensed into items so that they could follow naturally and grammatically from the item stem, and so they could all be rated using a common response scale. The last step was to thematically divide the items into subscales and consolidate these with three context and subject experts, prior to collecting data for the initial validation analyses.
2.2. Psychometric analyses of the initial Field Practice Self-Efficacy Questionnaire (stage 2)
2.2.1. Context and participants
The target population was Danish students in the newly reformed teacher education program (Act on the Education of Teachers of 2023), who had not yet completed field practice placement as part of their four-year long teacher education program. In the Danish teacher education, which is a four-year long programme leading to a Professional Bachelor’s degree, field practice amounts to 40 ECTS points (European Credit Transfer System), which is equivalent to two-thirds of a full-time study year. Field practice placements should take place in each of the four years of the program. In the first year of study, and possibly the second, field practice should consist of a prolonged period of time, for example with a period of time with one-day visits combined with a full-time block of field practice (Act on the Education of Teachers, 2023).
All participants in the validation part of the study were from one Danish university college. Data were collected using targeted online surveys distributed to first-year students, either immediately prior to school visits (start of field practice) or after a period of time with a school visit day every week and just prior to the first full-time placement. The sample for the current validation study consists of 303 students, who had only completed the PSEQ (c.f. section 2.2.2 on the instrument) once; two-thirds just prior to school visits (no field practice experience) and one-third after school visits and just prior to starting the first full time placement of three weeks (Table 1).
Students were divided equally on the two admission tracks to higher education in Denmark: grade-based and other qualifications (Table 1). The majority of the students (92.7%) were enrolled in the regular teaching education program, and the majority had chosen Danish as their major teaching subject (59.1%) (Table 1).
2.2.2. Item analysis by Rasch and graphical loglinear Rasch models
The Rasch model (RM, Rasch, 1960) generalized to ordinal items (i.e. the Partial Credit Model; Masters, 1982), also known as the one-parameter logistic model, was chosen for the current study, as it is the simplest possible IRT model (Fischer & Molenaar, 1995) and due to its measurement properties (c.f. the below). The Rasch model for ordinal data adheres to the same requirements for measurement as the original dichotomous Rasch model (Kreiner, 2013; Mesbah & Kreiner, 2013), and thus we simply use the term RM for Rasch model in this article. The basic requirements for measurement by the RM are: unidimensionality, in the sense that the items of a scale measure a single underlying latent construct, e.g. class management PSE. Monotonicity, which means that the expected item scores increase with increasing values on the latent variable. Thus, when class management PSE
Table 1
Characteristics of the Initial Validation Sample (N = 303)
Frequency (%) | |
Time of completion of the PSEQ | |
Prior to school visits (no FP) | 202 (66.7) |
After school visit, prior to full time FP | 101 (33.3) |
Admission track | |
Grade-based | 145 (47.9) |
Other qualifications | 158 (52.1) |
Teacher education program | |
Regular | 281 (92.7) |
Othera | 22 (7.3) |
Major teaching subject | |
Danish language | 179 (59.1) |
Mathematics | 88 (29.0) |
English | 33 (10.9) |
Otherb | 3 (1.0) |
Prior teaching experience | |
No | 148 (48.8) |
Yes | 155 (51.2) |
Mean teaching experience in months (SD), range | 19.1 (17.5), 1-100 |
Context of teaching experiencec | |
Public school | 124 (40.9) |
High school | 3 (1.7) |
Academy Professions Degree Programs (APDs) | 3 (1.7) |
University | 1 (0.3) |
Single (public) lectures | 15 (5.0) |
Gender | |
Female | 198 (65.3) |
Male | 105 (34.7) |
Mean age (SD), range | 23.4 (5.3), 17-68 |
Notes. FP = Field practice.
a includes STEM program, trainee program and distance (online) program.
b specific major not provided
c additional context not reported was peoples’ university.
increases, so should the expected scores on each of the items belonging to this scale. Local independence (or no local dependence; no LD), meaning that the item responses are conditionally independent given the latent variable. In other words, only the level of e.g. class management affects the responses to the questions, not the questions mutually. Absence of differential item functioning (no DIF), meaning that item responses and included exogenous variables are conditionally independent given the latent variable. That is, only the level of e.g. class management affects the responses to the questions and not variables outside the measurement model, such as gender or whether students have previous teaching experience, and so on. Homogeneity, meaning that the rank order of item parameters (item ‘difficulties’) is the same for all persons regardless of their level on the latent variable. Thus, the relative difficulty of the items would be the same for all persons, i.e. the item requiring the least self-efficacy to be endorsed would be the same for all, the hardest item to endorse would be the same for all, and so on.
Fulfilment of the first four of the above requirements ensures criterion-related construct validity as defined by Rosenbaum (1989). The additional fulfilment of the fifth requirement of homogeneity, which is only possible by fit to the RM (Kreiner, 2013; Rasch, 1960, 1961), means that the sum score is a sufficient statistic for the person parameter estimates. Thus, the response profile of a person provides no additional information on the latent variable’s score than does the total score.
With a newly developed instrument with many subscales, however, it is probable that they will not all fit pure RMs. Thus, we chose to also include graphical log-linear Rasch models (GLLRMs; Kreiner & Christensen, 2002, 2004, 2007), which are extended RMs. In GLLRMs it is possible to include DIF and LD by including interaction terms – between items in the case of LD and items and exogenous variables in the case of DIF – in the model, as long as the DIF and/or LD is uniform[1].
For models with evidence of uniform LD, we know that this entails somewhat lowered reliability of a scale than if the scale consisted only of conditionally independent items (Marais, 2013). This follows from the reduced variance in the item responses caused by items being more strongly correlated than what can be explained by the latent variable. Thus, if reliability calculations are not done in a manner taking into account any LD between items (e.g. Hamon & Mesbah, 2002), reliability will be spuriously inflated. LD, however, does not affect the sufficiency of the sum score (Kreiner & Christensen, 2007).
For models with evidence of uniform DIF, the results indicate that item responses fit a RM for each of the subgroups for which one or more items function differentially. It is thus possible to “split for DIF” (Hagquist et al., 2009), which effectively means that person parameter estimates are estimated for each of these subgroups separately. Since these estimates are on the same logit scale (theta), they are still comparable and can be used in subsequent statistical analyses and for individual assessment, and essential validity is maintained (Kreiner & Christensen, 2007). Many practitioners prefer to work with the sum scores and not the person parameter estimates resulting from the RMs. As one of the properties of the RM, and only the RM, is that the sum scores are sufficient for the person parameter estimates, and there is a one-to-one relationship between these (Rasch, 1960), we utilize this property to equate the sum scores for DIF (Kreiner, 2007a) to bring also the sum scores back on the same scale for unbiased subsequent statistical comparisons (Kreiner & Nielsen, 2023).
Furthermore, GLLRMs can be illustrated using chain graph models, where nodes represent variables and edges represent associations between variables. Thus, missing edges or arrows between nodes means that the variables in question are conditionally independent, given the remaining variables in the model. An arrow connecting two variables refers to a possible causal (at least in the sense of time) relationship as the association between them is directed, while undirected edges illustrate that the variables are conditionally dependent without assuming causality (Lauritzen, 1996, provides details of such models). The same rules apply to the items in a GLLRM (i.e. the measurement part of the GLLRM; Kreiner & Christensen, 2002; Nielsen & Santiago, 2020). Thus, items which are not connected by an edge are conditionally independent given the latent variable (i.e., items are locally independent). In the same manner, items which are not connected to an exogenous variable means that items and exogenous variables are conditionally independent given the latent variable and the other variables in the model (i.e., there is no DIF). The causal relationship between the latent variable and items is illustrated by arrows from the first to the latter, as are associations between exogenous variables and the latent variable. The GLLRM can also be used for assessing criterion validity, as it also contains a graphical model which allows for analysis of association between the exogenous variables (as independent variables) and the latent score (the dependent variable) (Kreiner & Christensen, 2002; Nielsen & Santiago, 2020).
2.2.3. Strategy of analyses and statistics used
The same strategy of analyses was used for each of the seven subscales. First, we tested fit of the set of item responses for a scale to the RM. If this was rejected, we catalogued departures from the RM in the form of LD and DIF in order to define a GLLRM with log-linear interactions for uniform LD and/or DIF and tested the fit to this GLLRM. If this was not successful, the items deemed most problematic were eliminated, and the iterative process started again. Each “test of fit” included several steps in order to test the fit as rigorously as possible:
- Fit of the individual items to the specified model by conditional infit and outfit statistics (Christensen, 2013; Kreiner & Nielsen, 2013) and by comparing the observed item-restscore correlations with the expected item-restscore correlations under the model (Kreiner, 2011).
- Tests of local independence for all item pairs using the same tests as for DIF (see below).
- Overall test of homogeneity of the item parameters across low- and high-scoring groups using Andersen’s (1973) conditional likelihood ratio (CLR) test.
- Overall tests of invariance relative to exogenous variables considered relevant for group comparisons in further studies using Andersen’s (1973) conditional likelihood ratio (CLR) test.
- Tests of no DIF for all items relative to the same exogenous variables using Kelderman’s (1984) CLR test of local independence as well as tests of conditional independence given scores using partial Goodman-Kruskal gamma coefficients (Kreiner & Christensen, 2004).
For tests of overall subscale invariance and DIF, the largest subgroup was used as the reference group in each exogenous variable. The exogenous variables were Time of completion of the PSEQ (prior to all field practice, after school visits but before full time field practice), Admission track (grade-based, other qualifications), Prior teaching experience (no, yes), Gender (female, male), and Age (-22, 23+).
When the final iteration was completed and fit was achieved for a subscale, analyses were concluded with the evaluation of targeting and reliability relative to the validation sample, as well as estimation of person parameters from the final model using weighted maximum likelihood estimation (Warm, 1989), as these are known to provide less biased estimates for the RM than other methods (Kreiner & Christensen, 2013). Hamon and Mesbah’s (2002) Monte Carlo method for reliability of Rasch scales was used, as this method takes into account any LD between items. Targeting of theta was assessed by two indices, which should both have a value close to one: the test information target index as the mean test information divided by the maximum test information for theta, and the root mean squared error (RMSE) target index, as the minimum standard error of measurement (SEM) divided by the mean SEM for theta (Kreiner & Christensen, 2013). In addition, the target and SEM of the observed score was calculated.
The Benjamini-Hochberg procedure was used to adjust for false discovery rate (FDR) due to multiple testing (Benjamini & Hochberg, 1995). In line with Poulsen et al. (2018), we followed Cox et al.’s (1977) recommendation to abstain from the deterministic decision criterion of 5% critical limit for p-values, and a distinction between weak to moderate evidence against the model (p > .01) and stronger evidence (p < 0.1) was used instead.
2.2.4. Criterion validity
Two modes of analyses were conducted to assess in a simple manner the criterion validity of the subscales in the PSEQ. First, the criterion variable (i.e. whether the student teachers had teaching experience prior to commencing the teacher education program or not) was included in the analyses by graphical loglinear Rasch models both as an exogenous variable for DIF-analyses in the measurement part of the model and as an endogenous variable in the inference part of the model (Nielsen & Santiago, 2020). Partial gamma correlation coefficients (Goodman & Kruskal, 1954) were used to inform any association between the criterion variable and the seven subscale scores, while taking into account associations with the other background variables in the model (Kreiner & Christensen, 2002, 2004, 2007). Second, mean subscale scores, adjusted for any discovered DIF, were compared for with and without prior teaching experience using Student’s t-tests for independent groups with 1000 bootstrap samples.
2.3. Software
Co-occurrence circles and item maps were created using R. Item analyses were conducted using the DIGRAM software package (Kreiner, 2003; Kreiner & Nielsen, 2013; 2023), and descriptives and Student’s t-test and effect sizes were done using SPSS.
3 | Results
3.1. Instrument development (stage 1)
3.1.1. Extracted information from qualitative sources and content analyses
The extraction of information from the interviews, written statements and the document with skills objectives resulted in a total of 70 raw statements on teacher and teaching-related practice that student teachers might have difficulty believing that they could enact or engage in during field practice. These statements were subsequently subjected to a content analysis. Statements with the same meaning (i.e., redundant statements) were combined, or one was chosen to represent them in the instrument, to form a total of 42 statements on unique practices. For example, the statements “know what it takes to help the weaker pupils” and “scaffold the weaker pupils” were reduced to the former statement, as this conveyed the meaning of both. As the meaning of the raw statements was very clear, this step was done by a single researcher with both content and test development expertise. An overview of how the 42 statements were mentioned by the various sources of information is shown in Figure 1.
3.1.2. Initial item pool and thematic subscales
The items were designed from the 42 unique statements on teacher and teaching-related activities that students might doubt they could engage in during field practice, so that they followed naturally from the item stem “In your upcoming field practice, how confident are you that you have sufficient abilities to …”, and could be rated using the response scale; very confident (3), confident (2), not particularly confident (1), not confident at all (0). Examples are the statements “cope with boundary-pushing children”, which resulted in the item “... deal with pupils who test boundaries”, and the statement “be prepared enough”, which resulted in the item “… be adequately prepared”. The items were developed in Danish and are shown in supplemental file 2, along with an English translation as well as both the numbering in which we refer to them in the article and the order in which they were presented in the questionnaire.
The items were thematically divided into subscales and subsequently consolidated by three context and subject experts. This resulted in seven initial subscales belonging to three domains of practice: Teaching-related PSE with the subscales Planning and preparation (7 items), Teaching in itself (7), Class management (7), and Differentiation (6); Relational PSE with the subscales Pupils (5) and Adult collaborators (parents and co-teachers) (4); and Evaluative and developmental PSE with the single subscale Evaluation and development (6). Figure 1 presents an overview of how the 42 statements and items were mentioned by the various informants and also illustrates the division into subscales.
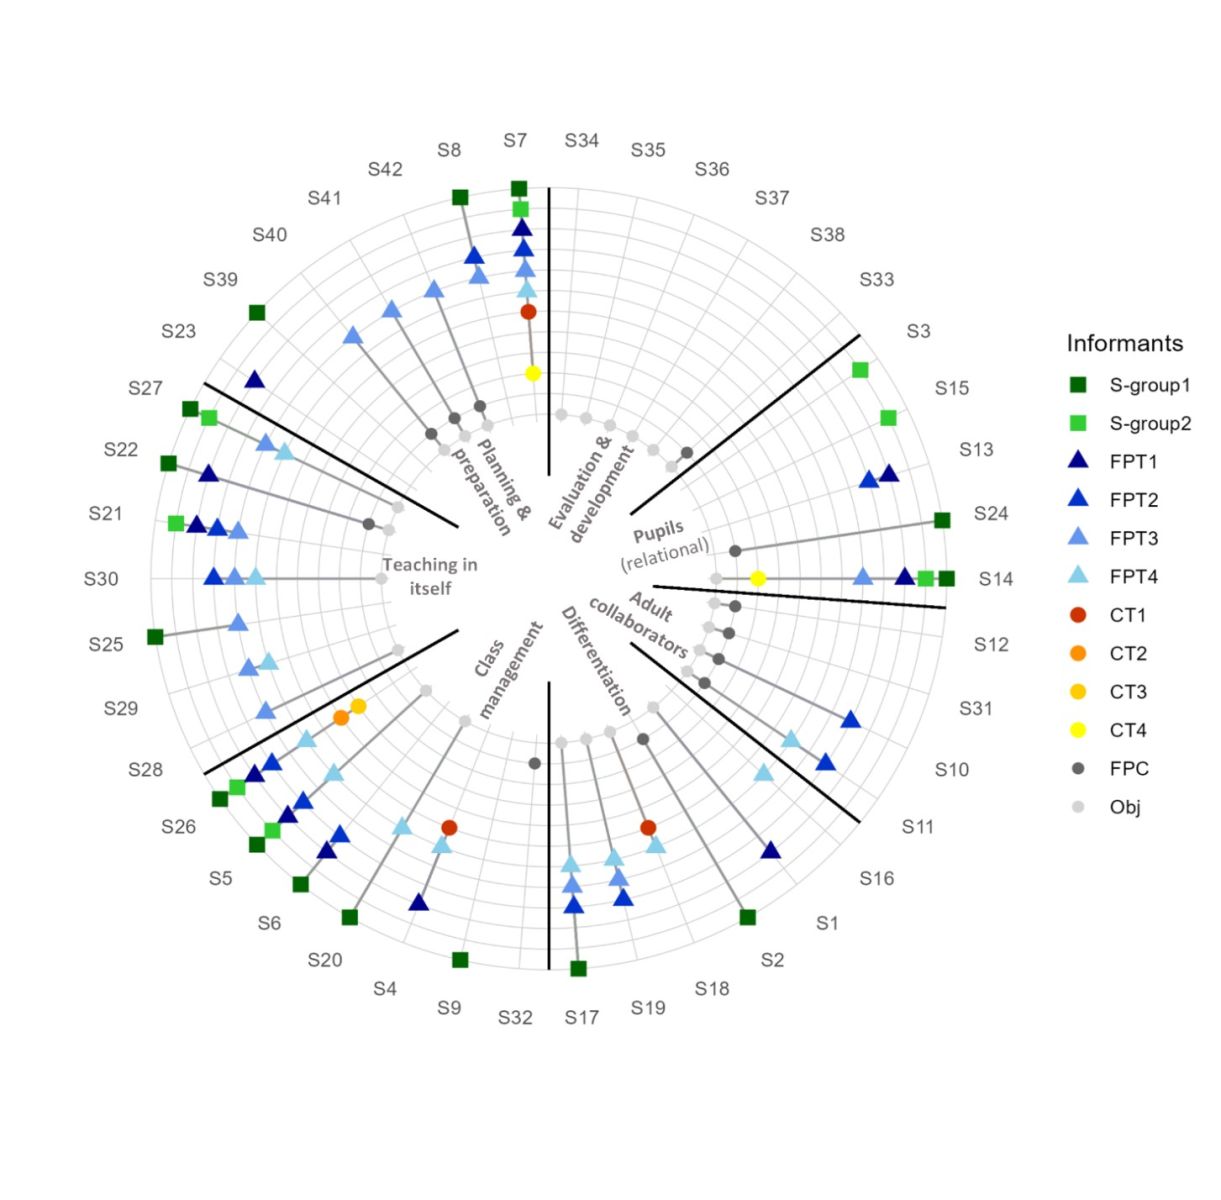
Figure 1
Overlap of Statements/Items on Teacher and Teaching-Related Practices across the 12 Sources of Information Divided into Subscales
Notes. S-groups = student focus groups, FPT = field-practice teachers, CT = Campus teachers, FPC = Field practice coordinator, Obj = official skills objectives for field practice.
A result that stands out in Figure 1 is the variation in the types of sources that have contributed information on teacher and teaching-related practices that student teachers might have difficulty believing they could engage in during field practice. The Planning and preparation, the Differentiation, and the Pupil subscales have been contributed to by all types of informational sources. At the other end of the spectrum, we see the Adult collaborators, to which neither students nor campus teacher contributed, as well as the Evaluation and Development subscale, where neither students, field-practice teachers, nor campus teachers have contributed information.
At this stage, we chose to eliminate statement 5 (... practice class management) from the Class management subscale, as it generally does not make sense to include a single item referring directly to the latent construct of the scale it belongs to. Thus, the Class management subscale was reduced to six items, and we moved forward with a total of 41 items.
The distribution of subscale scores shows that in the Adult collaborators subscale the full score range is used by students. In the remaining subscales, almost the full score range is being used, with only the lowest two to four not being utilized. While there is a slight skewness towards the higher end of the scales, they approximate a normal distribution well (Figure 2). The most right-skewed scores are in the teaching in itself and the pupils subscales, and the least skewed is the Adult collaborators subscale.
3.2. Item analyses (stage 2)
3.2.1. The final PSE subscale from psychometric analyses
Initial analyses rejected fit to the pure RM for all but one scale: the Differentiation subscale from the teaching-related PSE domain. Further analyses to discover specific departures from the Rasch model revealed that most departures consisted of items that were locally dependent. This was the case for the Planning and preparation and Teaching in itself subscale from the teaching-related PSE domain, the Adult collaborators subscale from the relational PSE domain, and the Evaluation and development subscale making up its own domain. For a single scale, the Class management subscale from the teaching-related PSE domain, the departure from the pure RM consisted of DIF. In addition, item 13 (... get the pupils to like me) was eliminated from the Pupils subscale from the relational PSE domain, as it was involved in two instances of local dependence and there was weak evidence against fit of this item, none of which could be resolved. Looking at the item content, it was concerned with relations to the pupils, but in a very general manner, which is likely the cause of the mentioned issues.
Following the elimination of item 13, and previously item 5, further analyses showed that two subscales fitted pure RMs: the 6-item Differentiation subscale and the 4-item scale Pupils subscale. There was no evidence against global homogeneity and no evidence against global invariance relative to time of completion of the PSEQ, admission track, prior teaching experience, age, or gender, except for weak evidence against gender invariance of the Pupils subscale (Table 2 and Table 3). However, as this evidence was weak, and there was no evidence of gender DIF, we leave this matter to be investigated further in future studies. There was no evidence against the fit of individual items (Appendices 6 and 8). The remaining five subscales all fitted simple GLLRMs.
The Planning and preparation subscale GLLRM only included strong local dependence between items 40 (... make plans for single lessons) and 41(... plan short teaching modules), and between items 41 and 42 (... plan long teaching modules) (Figure 3). There was no evidence against global homogeneity or against global invariance relative to the five exogenous variables (Table 2). There was no evidence of DIF or additional local dependence among items, nor was there evidence against the fit of individual items or the component item resulting from the local dependence between items 40, 41 and 42 (Appendix 3).
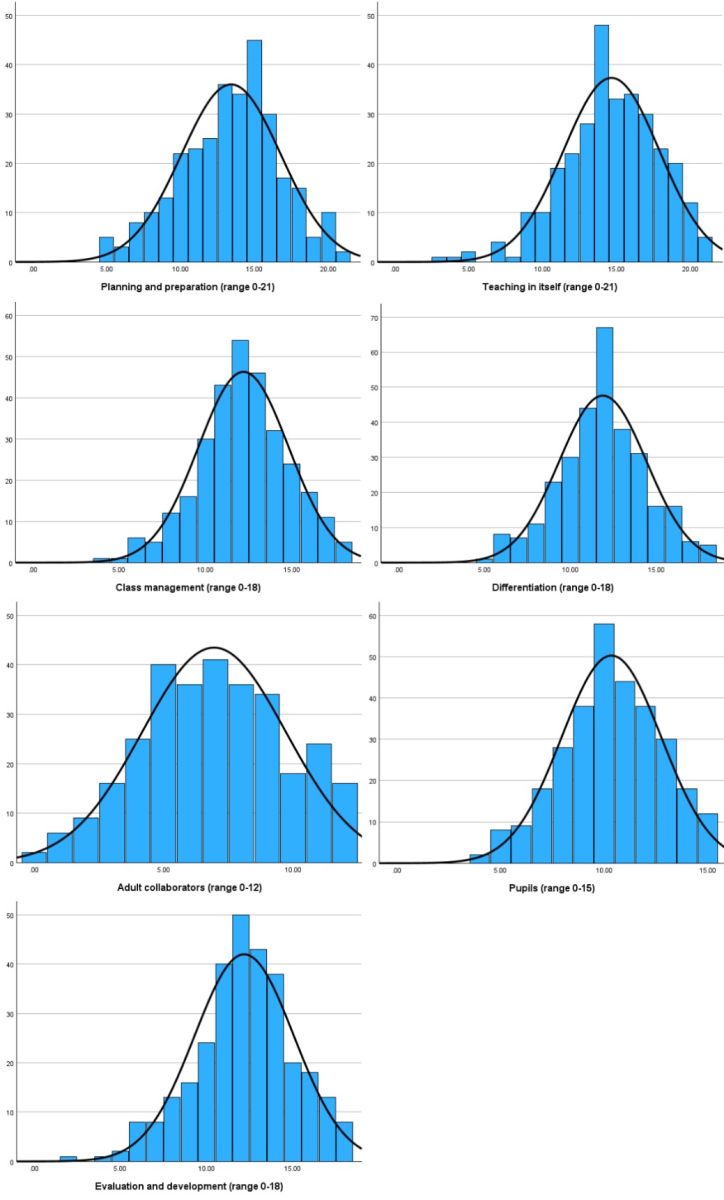
Figure 2
Distribution of Raw Sum Scores on each of the Seven PSEQ Subscales Prior to Item Analysis
Notes. Item 5 from the Class management subscale has been eliminated at this point. X-axis covers the score range of each subscale, while the Y-axis frequency range was set to 0-60.
The Teaching in itself subscale fitted a very simple GLLRM, which only included strong local dependence between item 25 (... "manage on my own" without the field-practice teacher) and item 30 (... stand in front of the pupils and teach) (Figure 3, Appendix 4). There was no evidence against global homogeneity and no strong evidence against global invariance relative to the five included exogenous variables (Table 2). There was no evidence against the fit of individual items or the component item representing the two locally dependent items, and no evidence of DIF or further local dependence between items (Appendix 4).
The Evaluation and development subscale fitted an equally simple GLLRM as the Teaching in itself subscale did (c.f. the above), as the only departure from the RM consisted of strong local dependence between items 33 (... evaluate my own teaching) and 35 (... contribute to the development of my fellow students' teaching practice on the basis of our common experiences) (Figure 5). There were no issues with evidence against global homogeneity or global invariance (Table 3), nor evidence against item fit, evidence of DIF or additional local dependence between items (Appendix 9).
The Adult collaborators subscale fitted the most complex GLLRM of all the subscales, as three of the four items were locally dependent and strongly so: items 10 (… write to/with parents) and 11 (… speak to/with parents), and items 11 and 12 (... contribute to parents' evening/parents-teacher meetings) (Figure 4). There was no evidence against global homogeneity and no evidence against global invariance relative to the five exogenous variables included (Table 3). There was no evidence against the fit of individual items or the component item representing the three locally dependent items, no evidence of DIF or further local dependence between items (Appendix 7).
The Class management subscale was the only subscale with evidence of DIF; item 4 (... be able to get the class to be quiet) functioned differentially relative to prior teaching experience, so that students with prior teaching experience systematically indicated greater confidence in being able to get the class to be quiet than students without prior teaching experience independent of their level of Class management self-efficacy. When including this DIF as an interaction in the subscale, there was no further evidence against fit to the GLLRM (Figure 3) of any kind, (Table 2 and Appendix 5).
In addition to documenting item fit and the necessity of any LD or DIF interactions, Appendices 3 through 9contain conversion tables with the necessary information for converting sum scores to weighted maximum likelihood estimates of the person parameters for each subscale. Also, the Appendices show that the bias of these estimates is very small except for at the extremes, where bias is always high (Table A3d though A9d). Thus, the person parameter estimates or the summed raw scores can be used as fitting for purpose. For the Class management subscale, an additional conversion Table (A5e) was added for the 5-item DIF-free scale, so that all subscales may be used without having to equate sum scores or split the person parameter estimates to overcome DIF.
Table 2
Global Tests of Homogeneity and Invariance for the Four Teaching-Related PSE Subscales of the PSEQ under the Final RMs or GLLRMs
Tests of fit | Plan-7 (RM)a | Teach-7 (RM)b | Cman-6 (GLLRM)c | Diff-6 (RM)d | ||||||||
CLR | df | p | CLR | df | p | CLR | df | p | CLR | df | p | |
Global homogeneity | 36.3 | 30 | 0.198 | 17.3 | 26 | 0.900 | 17.9 | 19 | 0.531 | 13.8 | 16 | 0.612 |
Global Invariance relative to: | ||||||||||||
Time of PSEQ | 48.9 | 30 | 0.016+ | 22.2 | 26 | 0.677 | 10.0 | 19 | 0.394 | 41.0 | 16 | 0.001+ |
Admission track | 44.8 | 30 | 0.040+ | 45.4 | 26 | 0.011+ | 21.7 | 19 | 0.299 | 25.0 | 16 | 0.071 |
Prior teaching experience | 29.8 | 30 | 0.478 | 48.5 | 26 | 0.005+ | 26.8 | 19 | 0.021+ | 10.4 | 16 | 0844 |
Gender | 39.6 | 30 | 0.114 | 47.2 | 26 | 0.007+ | 32.8 | 19 | 0.025+ | 13.4 | 16 | 0.646 |
Age groups | 41.6 | 30 | 0.077 | 26.4 | 26 | 0.444 | 28.0 | 19 | 0.083 | 16.1 | 16 | 0.446 |
Notes. RM: Rasch model; GLLRM: Graphical loglinear Rasch model; CLR: Conditional likelihood ratio; df: degrees of freedom; p: p-value. Global homogeneity test compares items parameters in approximately equal-sized groups of high and low scoring students. The critical limits for the p-values after adjusting for false discovery rate were: + 5% limit p = .0083, 1% limit p=0.0017.
a There is local dependence between items 40 and 41, and between items 41 and 42.
b There is local dependence between items 25 and 30.
c Item 4 functions differentially relative to prior teaching experience.
d Item 5 was excluded from the final subscale.
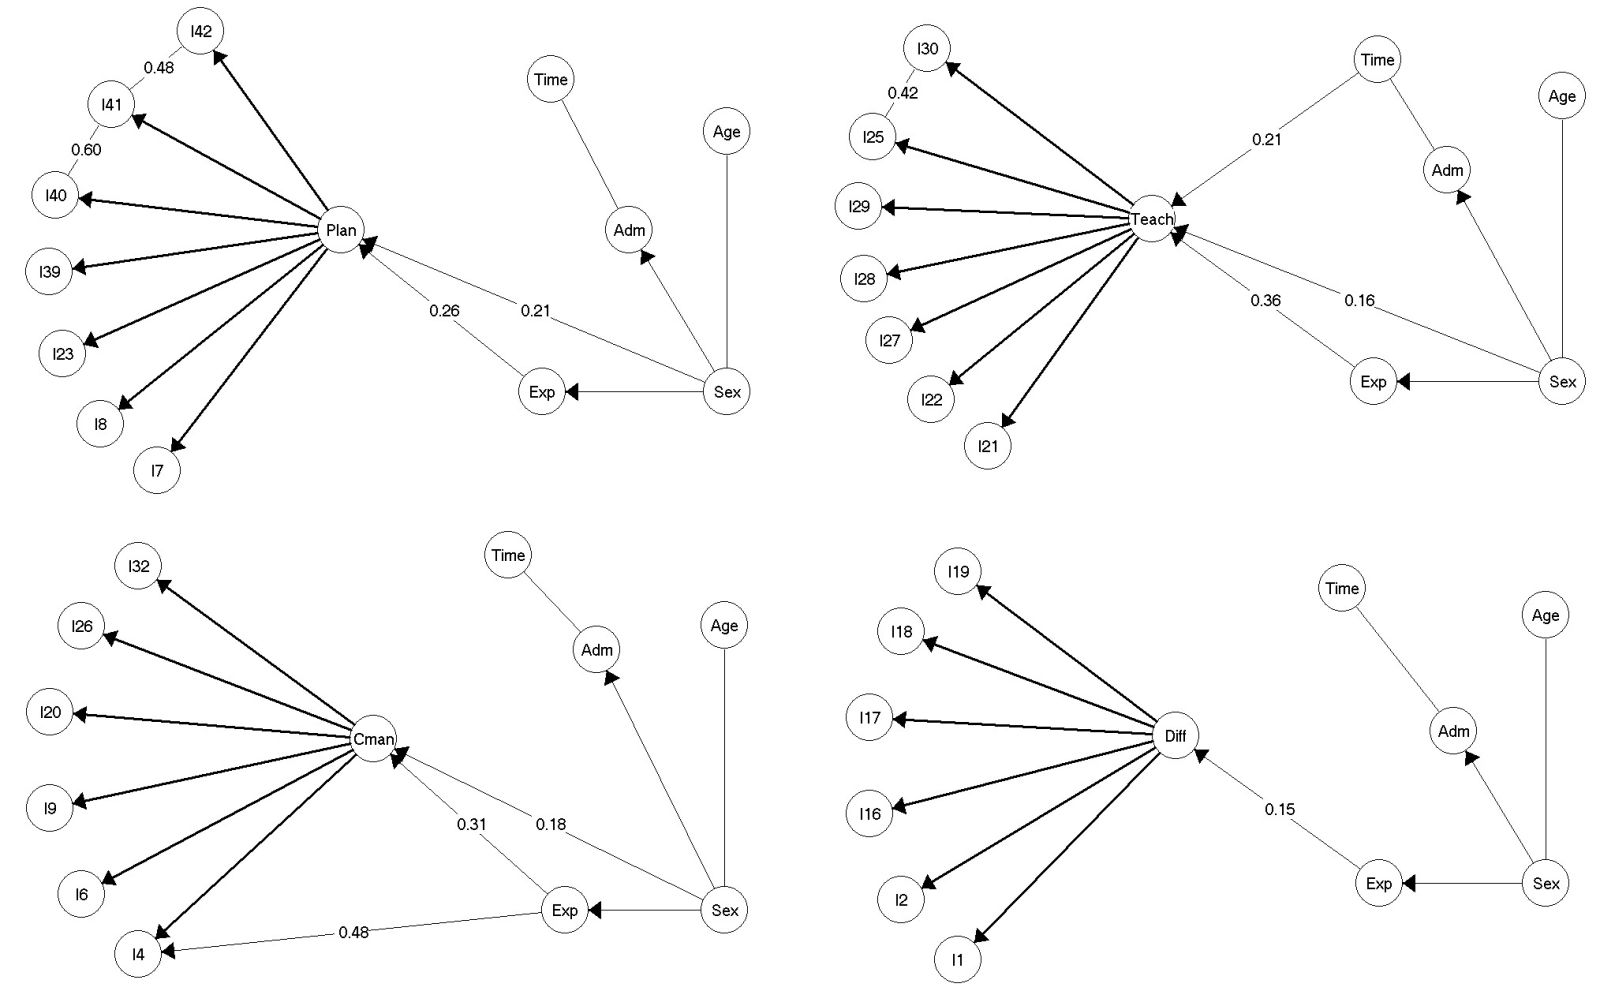
Figure 3
The Final Rasch and Graphical Loglinear Rasch Models for the Four Teaching-Related PSE Subscales; Planning and Preparation (Top Left), Teaching in Itself (Top Right), Class Management (Bottom Left), Differentiation (Bottom Right)
Notes. γ-correlations are partial Goodman and Kruskal’s rank correlations for ordinal data. Adm = Admission track (grade-based vs. other qualifications), Exp = Prior teaching experience (no vs. yes), Time = time of completion of PSEQ (Prior to school visits (no FP) vs. after school visit, prior to full time FP), Sex (female vs. male), Age (22 years and younger vs. 23 years and older).
Table 3
Global Tests of Homogeneity and Invariance for the Two Relational PSE Subscales and the Evaluative and Developmental PSE Subscale of the PSEQ under the Final RM or GLLRMs
Tests of fit | Adults-4 (GLLRM)a | Pupils-4 (RM)b | Eval-6 (GLLRM)c | ||||||
CLR | df | p | CLR | df | p | CLR | df | p | |
Global homogeneity | 11.5 | 25 | 0.990 | 7.1 | 9 | 0.625 | 23.9 | 19 | 0.200 |
Global Invariance relative to: | |||||||||
Time of PSEQ | 37.2 | 25 | 0.055 | 15.3 | 9 | 0.082 | 24.8 | 19 | 0.168 |
Admission track | 31.0 | 25 | 0.190 | 11.2 | 9 | 0.265 | 25.9 | 19 | 0.133 |
Prior teaching experience | 43.3 | 25 | 0.013+ | 4.4 | 9 | 0.880 | 13.8 | 19 | 0.794 |
Gender | 30.8 | 25 | 0.197 | 23.8 | 9 | 0.005+ | 22.6 | 19 | 0.257 |
Age groups | 36.0 | 25 | 0.071 | 16.3 | 9 | 0.061 | 19.3 | 19 | 0.440 |
Notes. RM: Rasch model; GLLRM: Graphical loglinear Rasch model; CLR: Conditional likelihood ratio; df: degrees of freedom; p: p-value. Global homogeneity test compares items parameters in approximately equal-sized groups of high and low scoring students. The critical limits for the p-values after adjusting for false discovery rate were: + 5% limit p = .0083, 1% limit p=0.0017
a There is local dependence between items 10 and 11, and between items 11 and 12.
b Item 13 was excluded from the final subscale.
c There is local dependence between item 33 and 35.
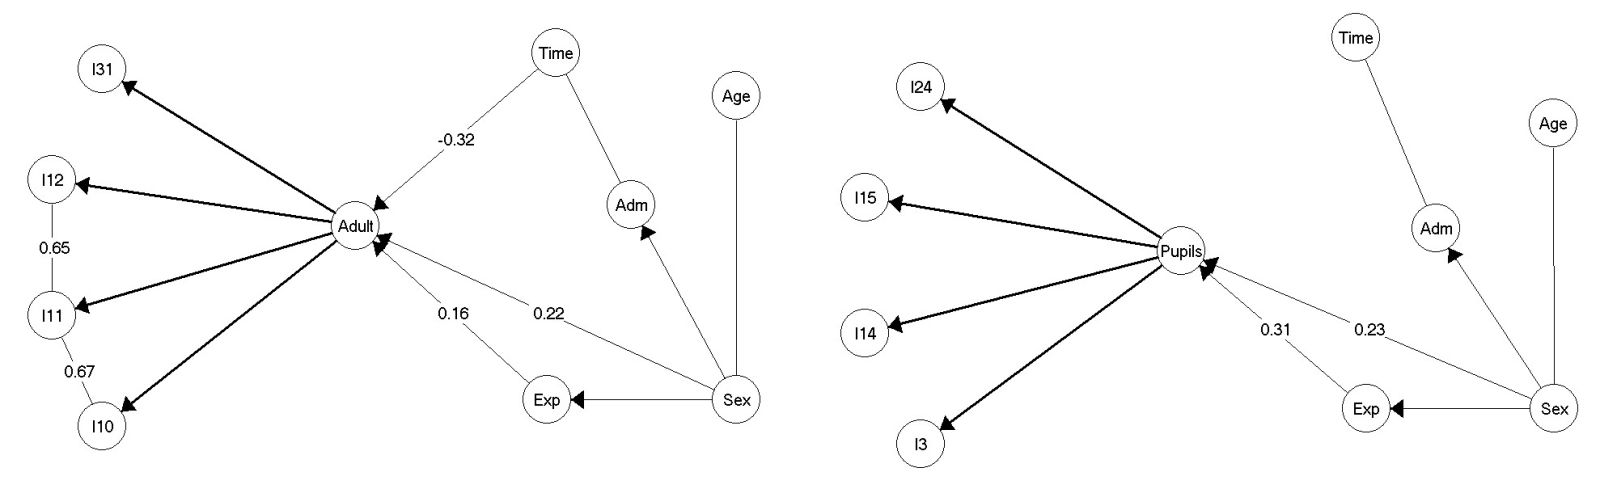
Figure 4
The Final Rasch and Graphical Loglinear Rasch Models for the Two Relational PSE Subscales; Adult Collaborators (Left), Pupils (Right).
Notes. γ-correlations are partial Goodman and Kruskal’s rank correlations for ordinal data. Adm = Admission track (grade-based vs. other qualifications), Exp = Prior teaching experience (no vs. yes), Time = time of completion of PSEQ (Prior to school visits (no FP) vs. after school visit, prior to full time FP), Sex (female vs. male), Age (22 years and younger vs. 23 years and older).
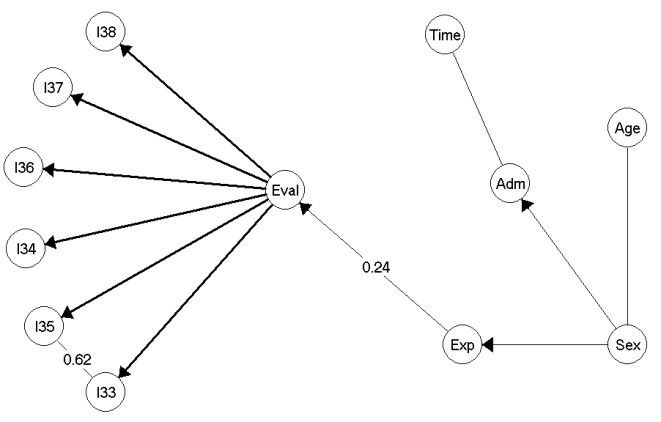
Figure 5
The Final Rasch and Graphical Loglinear Rasch Models for the Evaluation and Development Subscale Making Up the Evaluative and Developmental PSE Domain.
Notes. γ-correlations are partial Goodman and Kruskal’s rank correlations for ordinal data. Adm = Admission track (grade-based vs. other qualifications), Exp = Prior teaching experience (no vs. yes), Time = time of completion of PSEQ (Prior to school visits (no FP) vs. after school visit, prior to full time FP), Sex (female vs. male), Age (22 years and younger vs. 23 years and older).
3.2.2. Effect of DIF in the Class management subscale
To evaluate the effect of the DIF on item 4 in the Class management subscale, the summed scores were adjusted by DIF-equating via the person parameter estimates, thus making the DIF-adjusted scores comparable across prior teaching experience subgroups and facilitate true group comparisons (Appendix 5).
Equating he sum score for the teaching experience DIF in the Class management subscale did not change the conclusion of a significant difference in mean scores dependent on prior teaching experience, only the magnitude of the difference was slightly reduced (Mean differenceobserved = 1.30, Mean differenceadjusted = 1.11) (Table 4).
Table 4
Comparison of Observed and DIF-Adjusted Mean Class Management Scores for Student with and without Prior Teaching Experience
Item-restscore correlations | |||||||
DIF groups (n) | Observed scores | Adjusted scores | |||||
Mean | SE | Mean | SE | Bias | |||
No prior teaching experience (148) | 11.53 | .21 | 11.53 | .21 | .00 | ||
Prior teaching experience (155) | 12.83 | .20 | 12.64 | .21 | .19 | ||
p | <.001 | <.001 | |||||
Notes. SE, Standard error.
At the individual level, DIF-equating of the Class management scores meant that scores were reduced by up to half a point for students with prior teaching experience to obtain scores that were on the same scale as those for students without prior teaching experience. With normal rounding rules to achieve integer scores, the lower half of the score range would be reduced with a whole point for students with teaching experience prior to commencing teacher education. Thus, DIF-equating or splitting for DIF is necessary before using the sum scores and the person parameter estimates, respectively, in statistical analyses (Appendix 5).
3.2.3 Targeting and reliability
Six subscales were well-targeted to the study sample, with test information target indices indicating that 74% to 92% of the maximally obtainable information was obtained. The exception was the Planning and preparation subscale, which only had acceptable targeting with approximately 65% information obtained (Table 5). RMSE target indices were close to one for all subscales, indicating that standard error of measurement for theta was close to the lowest possible for the scales. For most of the subscales, the item thresholds covered the same range on the scales as did the person parameter estimates of the students (c.f. the item maps in Figures A3 through A9 in Appendices 3 through 9). The item maps also showed that, for all but the Evaluation and development subscale, the test target value (i.e. where most information is provided) was located at the lower end of the scales and thus lower than the student mean scores on the latent variables. Lastly, the item maps illustrate that the information level is relatively high across the part of the scales where the majority of the students are located.
Person separation indices for theta ranged from 0.72 to 0.81, while reliability (taking into account any locally dependent items) of the scores ranged from 0.66 to 0.80. Only the two Relational PSE subscales, Pupils and Adult collaborators, had reliabilities lower than 0.70 (Table 5).
Targeting and Reliability of the Seven Subscales of the PSEQ (N = 303)
Theta (q) | Score | ||||||||||||||
Subscalea | Target | Mean | TI mean | TI max | TI Target index | RMSE mean | RMSE min | RMSE target index | PSI | Target | Mean | Target SEM | Mean SEM | re | |
Plan | -1.37 | 0.82 | 2.758 | 4.212 | 0.655 | 0.609 | 0.489 | 0.800 | 0.75 | 6.41 | 13.41 | 2.05 | 1.66 | 0.76 | |
Teach | -1.00 | 1.70 | 2.093 | 2.819 | 0.743 | 0.706 | 0.596 | 0.844 | 0.78 | 8.21 | 14.65 | 1.68 | 1.44 | 0.80 | |
Cmanb | |||||||||||||||
No exp | -1.41 | 1.07 | 1.671 | 2.058 | 0.812 | 0.774 | 0.697 | 0.900 | 0.78 | 7.09 | 11.53 | 1.43 | 1.29 | 0.74 | |
Exp | -1.30 | 1.72 | 1.508 | 1.975 | 0.764 | 0.810 | 0.712 | 0.878 | 0.79 | 7.81 | 12.64 | 1.41 | 1.22 | 0.75 | |
Diff | -0.73 | 1.30 | 1,770 | 1.989 | 0.890 | 0.751 | 0.709 | 0.944 | 0.75 | 8.13 | 11.88 | 1.41 | 1.33 | 0.72 | |
Adult | -0.76 | 0.14 | 2.519 | 2.804 | 0.898 | 0.601 | 0.597 | 0.993 | 0.76 | 4.46 | 6.95 | 1.67 | 1.58 | 0.66 | |
Pupils | 0.64 | 1.20 | 1.125 | 1.222 | 0.920 | 0.926 | 0.904 | 0.977 | 0.72 | 7.80 | 8.41 | 1.11 | 1.06 | 0.69 | |
Eval | 2.21 | 1.52 | 1.658 | 1.818 | 0.912 | 0.776 | 0.742 | 0.956 | 0.81 | 13.38 | 12.18 | 1.35 | 1.28 | 0.80 | |
Note. q, theta; Targeting and reliability is provided for groups defined by differential item functioning (DIF) variables and subgroups in variables associated with the latent PTSD variable; Tl, test information; RMSE, root mean squared error of the estimated theta score; SEM, standard error of measurement of the observed score; r, reliability; Plan, Planning and preparation; Teach, Teaching in itself; Cman, Class management; Exp, teaching experience; Diff, Differentiation; Adult, Adult collaborators; Eval, Evaluation and development.
a In case of differential item function, results are shown for subgroups.
b Weighted mean PSI across subgroups = 0.77, weighted mean reliability = 0.75.
3.3. Criterion validity
Both avenues of testing the criterion validity of the seven sub-constructs of the PSEQ confirmed our a priori expectation that student teachers with teaching experience prior to commencing the teacher education program would have higher PSE than students without such experience. In the final models shown in Figures 3, 4, and 5, it is evident that of the included criterion variables, only prior teaching experience was associated with PSE, and this was the case for all seven PSE sub-constructs. The gamma correlations between prior teaching experience and the seven PSE sub-construct scores ranged from 0.15 (moderate) for Differentiation PSE to 0.36 (strong) for Teaching in itself PSE (Kreiner, 2007b).
Turning to the tests of differences in the mean subscale scores for students with and without prior teaching experience, these also confirm our expectations. For all seven subscales, the mean scores of students with prior teaching experience were higher and significantly so, when compared to the students without prior teaching experience (Table 6). For all constructs except Differentiation PSE, the evidence of such differences is very strong. The effect sizes, Cohen's d, ranged from a small effect (i.e. -.203 for Differentiation PSE) to a moderate effect (i.e. -.617 for Teaching in itself PSE). Thus, criterion validity in relation to prior teaching experience was confirmed for all PSE sub-constructs.
Table 6
Comparison of Subscale Scores for Student Teacher with and without Teaching Experience Prior to Commencing Teacher Education
Subscales and experience groups | 95 % Confidence Interval | Independent samples test | ||||||
Mean | SD | Lower | Upper | t | df | pa | Cohen’s d | |
Planning and preparation | ||||||||
No prior teaching experience | 12.74 | 3.34 | 12.18 | 13.26 | -3.487 | 301 | <.001 | -.401 |
Prior teaching experience | 14.06 | 3.26 | 13.55 | 14.57 | ||||
Teaching in itself | ||||||||
No prior teaching experience | 13.68 | 3.22 | 13.14 | 14.20 | -5.358 | 301 | <.001 | -.617 |
Prior teaching experience | 15.59 | 2.98 | 15.11 | 16.05 | ||||
Class management | ||||||||
No prior teaching experience | 11.53 | 2.60 | 11.12 | 11.93 | -3.702 | 301 | <.001 | -.425 |
Prior teaching experience | 12.64 | 2.60 | 12.20 | 13.02 | ||||
Differentiation | ||||||||
No prior teaching experience | 11.62 | 2.68 | 11.19 | 12.05 | -1.767 | 301 | .039 | -.203 |
Prior teaching experience | 12.14 | 238 | 11.77 | 12.53 | ||||
Adult collaborators | ||||||||
No prior teaching experience | 6.44 | 2.81 | 5.98 | 6.93 | -3.154 | 301 | <.001 | -.363 |
Prior teaching experience | 7.43 | 2.67 | 6.97 | 7.87 | ||||
Pupils (relational) | ||||||||
No prior teaching experience | 7.96 | 1.91 | 7.66 | 8.28 | -4.095 | 301 | <.001 | -.471 |
Prior teaching experience | 8.83 | 1.80 | 8.55 | 9.14 | ||||
Evaluation and development | ||||||||
No prior teaching experience | 11.68 | 2.96 | 11.21 | 12.13 | -3.007 | 301 | <.001 | -.346 |
Prior teaching experience | 12.66 | 272 | 12.22 | 13.11 | ||||
Notes. There was no evidence against homogeneity of variance across subgroups for any of the scales, and thus the standard t-test was used.
a p is one-sided.
4 | Discussion and implications
The purpose of the study was to develop and conduct a first validity study of a multidimensional instrument for the measurement of practice self-efficacy for student teachers specifically targeting the context of field practice within the teacher education. We used a qualitative approach to obtain detailed information on the teacher and teaching-related activities that the student teacher could doubt they had sufficient abilities and skills to engage in during field practice. We collected this information from a broad group of field practice stakeholders including student teachers, field practice teachers, university college on-campus teachers, a field practice coordinator and the official skills objectives for field practice in the teacher education program in Denmark.
The results proved very positive, as 40 of 42 developed items were retained in seven subscales within three domains of teacher and teaching-related practices. The individual subscales all fitted either pure Rasch models or very simple graphical loglinear Rasch models. Only a single item suffered from differential item functioning. The targeting of the scales ranged from good to excellent, and five subscales had reliabilities making them suitable for statistical analysis, while two had lightly lower reliabilities. In addition, a simple test of criterion validity against having had teaching experience prior to commencing teacher education showed the expected pattern: that student teachers with previous teaching experience scored significantly higher on all subconstructs than students without previous teaching experience.
As the results largely speak for themselves and we have included very detailed documentation, as well as conversion tables to allow use of raw summed scores (in one case equated for differential item functioning) or person parameter estimates, we only discuss selected results and focus on implications for teacher education as well as future directions for research.
4.1. Psychometric properties
As no previous scales have been developed and validated for the specific purpose of targeting the practice self-efficacy for student teachers in relation to field practice, there is no real basis for discussing psychometric properties in relation to previous research. Thus, we settle for picking up on a few points. Both the Teachers' Sense of Efficacy Scale (TSES) (Tschannen-Moran & Woolfolk Hoy, 2001) and the Student Teachers’ Instructional Self-Efficacy in Technology-Rich Classrooms questionnaire (Elstad & Christophersen, 2017) include subscales which are in item content similar to the Class management subscale in the current study. The Maintaining discipline subscale in Elstad and Christophersen (2017) consisted of three items asking student teachers how certain they are that they can “persuade even the most gaming-interested students to concentrate on school-related tasks?”, “persuade students who often switch among different social media to follow classroom rules”, and “persuade all students to concentrate on educational tasks without being disturbed by other Internet-based material?” (p. 6). The items were rated using a seven-point response scale from low to high, and reliability was reported to be 0.89. Tschannen-Moran and Woolfolk Hoy (2001) included an eight-item Classroom management subscale where teachers are asked to rate how much they can do to… or how well they can … “…control disruptive behavior in the classroom?”, “…get children to follow classroom rules?”, “… calm a student who is disruptive or noisy?”, “…establish a classroom management system with each group of students?”, “… you keep a few problem students from ruining an entire lesson?”, “… respond to defiant students?”, “… make your expectation clear about student behavior?”, and “… establish routines to keep activities running smoothly?” (p. 800). The items were rated using a nine-point response scale where only the odd number categories had labels conveying the meaning of the category, and reliability was reported to be 0.90. The Practice Self-Efficacy questionnaire developed in the current study included the Class management subscale and it consisted of five items; “... be able to get the class to be quiet”, “... find the right balance between being an authority and a friend”, “ ... have sufficient knowledge to appear as an authority”, “ ... find the right balance between pedagogical work and the fact that learning shall also take place”, “ ... combine subject-specific knowledge and personal skills in the teacher role”, and “… organise group work among pupils”. Student teachers were prompted to rate the items by asking: In your upcoming field practice, how confident are you that you have sufficient abilities to …, using a four-point response scale where categories can be readily distinguished from each other: very confident (3), confident (2), not particularly confident (1), not confident at all (0). Reliability of this scale was 0.74 and 0.75 for students without and with teaching experience prior to commencing teacher education, respectively.
Evidently, the reliability of the Class management subscale in the current study is the lowest compared to the previously developed similar scales. This is more than likely due to the differences in the number of response categories, as the current study utilizes only four categories and the other studies have seven and nine, respectively. This may be construed to be a weakness in the current study and the developed questionnaire. However, it may also be seen as a strength, as the current study has labels defining the meaning of all response categories, and thus students know what their reply means and we know how to interpret the responses. At the more general level, the subscales in the current PSEQ reached a reliability level making them suitable for statistical purposes, but not for assessment at the individual. Level. The two subscales in the relational dimension of the PSEQ, did however, also fall below the conventional limit for reliability of 0.7 for statistical purpose. Thus, larger samples are necessary in order to follow changes in relational practice self-efficacy.
4.1.1. The broad spectrum of stakeholders and targeting of subscales
The choice to include a broad spectrum of teacher education field practice stakeholders to contribute information on which teacher and teaching-related practices that student teachers might doubt they could engage in during field practice appears to have been worthwhile, as shown by the distribution of practices across stakeholders in Figure 1. Had we only included the most central stakeholder, i.e., the students, we would have missed a lot of practices. Even if we had included both students and field practice teachers, we would still have missed a substantial number of practices. Teacher and teaching-related practices, which contributed to the creation of subscales, would have been missed entirely with fewer stakeholders The many different stakeholders allowed us to include items covering a wide range of challenges, from those universally recognized to those perceived by only a few. This is not only important in terms of measurement precision, but also crucial for purposes of assessing student practice self-efficacy in relation to field practice as the teacher education progresses. If students do not see the relevance in the questions, response rates will be low. This will, in turn, lead to inaccurate assessment of where it might be productive to support students with the purpose of enhancing their practice self-efficacy prior to field practice. Thus, targeting is crucial, and we suggest that we have achieved a good targeting due to the inclusion of the broad spectrum of stakeholders. Furthermore, the visual analysis in identifying common and unique challenges for the student teachers proved valuable, as that might be overlooked in a more homogeneous or less structured approach to item development.
4.2. Criterion validity
Criterion validity in relation to prior teaching experience was confirmed for all PSE sub-constructs. The comparisons between student teachers with and without teaching experience prior to commencing teacher education (Table 6) showed significant differences of varying magnitude between the two groups with student teachers who had teaching experience before commencing teacher education having higher practice self-efficacy scores. The fact that it was possible to see moderate effect sizes between groups of students with and without teaching experience prior to the teacher education program this early in the teacher education program indicates that we are indeed tapping into self-efficacy, as experience and mastery are expected to boost self-efficacy (Bandura, 1997).
4.3. Implications for teacher education and future directions in research
The results of the study point to both practical implications and possibilities of utilizing knowledge on practice self-efficacy within the teacher education as well as to directions for future research into practice self-efficacy. The two are interrelated and thus we discuss them together.
The small and even moderate effect sizes between groups of students with and without teaching experience prior to the teacher education program for all seven dimensions of practice self-efficacy this early in the teacher education program (Table 6) opens several avenues for utilization within the teacher education as well as directions for future research. One area of both practical utilization and future research would be to study changes in practice self-efficacy over time, e.g., before, during, and after field practice and across all years of teacher education. Previous research has documented changes in self-efficacy across field practice for student teachers, (c.f. the introduction), but none have studied changes in practice self-efficacy with a multidimensional instrument designated to student teachers field practice. Neither have previous studies been conducted for the entire length of teacher education programs. Change studies are, however, only possible at the group level, as reliabilities do not allow assessment at the individual level. Furthermore, the two relational practice self-efficacy scales are not content valid in the sense that teaching practices within these are missing. This is due to the development method, where we only developed items based on the information provided by stakeholders without prompting for more detailed information. Thus, a future avenue of research could thus be to develop additional items for the two relational subscales. This could be done by conducting more structured interviews focused specifically on teacher -and teaching-related practices concerned with either the relations with pupils or with adult collaborators. Longer subscales would also improve reliability.
By augmenting the function of field practice as a bridge between theoretical and practical knowledge and skills, a focus on self-efficacy development offers new approaches to educative efforts in relation to field practice. Bandura’s (1997) four proposed sources of self-efficacy suggest that the efforts of various stakeholders should encompass verbal persuasion, supportive discourse, and affective states (such as stress reduction), beyond personal experience and vicarious learning, in order to scaffold practice self-efficacy. Knowledge of the initial levels of practice self-efficacy of student teachers can, given its multidimensional nature, help educators identify areas of teacher and teaching-related practices where students feel less confident and tailor the preparatory teaching to enhance student PSE in the particular areas accordingly. Another avenue of both practical utilization and future research into the practice self-efficacy of student teachers would be to study the multidimensional self-efficacy profiles of students and their possible role as predictors of outcomes such as drop-out and academic results within teacher education. Such a strand of research and/or practical utilization could also benefit from including information on the actual experiences with teaching practices, during field practice. This could, for example, be achieved by including instruments such as the field practice experience scale, measuring opportunities to learn through observation, own practice, and receiving feedback on these practices (Nielsen, 2021; 2024). The joining of such two strands of research might provide entirely new insights into the development of field practice self-efficacy for student teachers, as self-efficacy interacts with opportunities to learn over time.
The current study sample included only first year student teachers, and this may have reduced the variation in the data. Thus, future research should include students from all years in teacher education to evaluate reliability in broader samples.
The Practice Self-Efficacy Questionnaire for student teachers is a promising tool for both research and practical educational purposes. However, the two relational subscales are in need of further expansion to capture sufficiently content valid and precise measures of practice self-efficacy relational PSE in the context of adult collaborators and the context of the pupils.
Appendices
- Appendix 1. Description of skills objectives
- Appendix 2. Original Danish items and English translation
- Appendices 3 through 9. Additional results from the item analyses for each of the seven subscales of the PSEQ; 3. Planning and preparation, 4. Teaching in itself, 5. Class management, 6. Differentiation, 7. Pupils, 8. Adult collaborators, 9. Evaluation and development.
Author contributions
Conceptualization: Tine Nielsen
Data curation: Tine Nielsen
Formal analysis: Tine Nielsen, Morten Pettersson
Funding acquisition: Tine Nielsen
Investigation: Tine Nielsen, Line Toft, Dag Munk Lindemann, Emma Heise Nielsen
Methodology: Tine Nielsen
Project administration: Tine Nielsen
Resources: Tine Nielsen, Dag Munk Lindemann, Line Toft, Emma Heise Nielsen
Software: Morten Pettersson, Tine Nielsen.
Supervision: Tine Nielsen
Validation: Tine Nielsen
Visualisation: Tine Nielsen, Morten Pettersson
Writing – original draft: Tine Nielsen, Morten Pettersson, Line Toft
Writing – review & editing: Tine Nielsen, Morten Pettersson, Line Toft, Dag Munk Lindemann, Emma Heise Nielsen
Funding
The author(s) received no specific funding for this work from any funding agencies.
Conflict of Interest
The authors declare no conflict of interest.
Data Availability Statements
The dataset used for producing the circle plot in Figure 1 is available through zenodo.org. The remaining data is not available as the project is ongoing and in compliance with the European Data Protection Rules data thus cannot be made freely available.
How to Cite:
Nielsen, T., Pettersson, M., Toft, L., Lindemann, D. M., & Nielsen, E. H. (2024). Development and initial validation of the Practice Self-Efficacy Questionnaire (PSEQ) for student teachers. Educational Methods & Psychometrics, 2:13.
[1] Uniform DIF exists when the statistical relationship between the item response and group is constant for all levels of a matching variable” (Hanson, 1998, pp. 244.). Similarly, uniform LD exists when the statistical relationship between responses to two items is constant for all levels of a matching variable.
References
References
Act on the Education of Teachers of 2015, Bekendtgørelse om uddannelsen til professionsbachelor som lærer i folkeskolen, BEK nr. 1068 af 08/09/2015 (2015). https://www.retsinformation.dk/eli/lta/2015/1068
Act on the Education of Teachers of 2023, Bekendtgørelse om uddannelsen til professionsbachelor som lærer i folkeskolen, BEK nr. 374 af 29/3/2023 (2023). https://www.retsinformation.dk/eli/lta/2023/374
Andersen, E. B. (1973). A goodness of fit test for the Rasch model. Psychometrika, 38(1), 123–140. https://doi.org/10.1007/BF02291180
Alsup, J. (2005). Teacher identity discourses: Negotiating personal and professional spaces. Routledge. https://doi.org/10.4324/9781410617286
Anspal, T., Leijen, Ä., & Löfström, E. (2018). Tensions and the teacher’s role in student teacheridentity development in primary and subject teacher curricula. Scandinavian Journal of Educational Research, 63(5), 679–695. https://doi.org/10.1080/00313831.2017.1420688
Atay, D. (2007). Beginning teacher efficacy and the practicum in an EFL context. Teacher Development, 11(2), 203–219. https://doi.org/10.1080/13664530701414720
Bandura, A. (1997). Self-efficacy: The exercise of control. W. H. Freeman and Company.
Bartimote-Aufflick, K., Bridgeman, A., Walker, R., Sharma, M., & Smith, L. (2015). The study, evaluation, and improvement of university student self-efficacy. Studies in Higher Education, 41(11), 1918–1942. https://doi.org/10.1080/03075079.2014.999319
Benjamini, Y., & Hochberg, Y. (1995). Controlling the false discovery rate: A practical and powerful approach to multiple testing. Journal of the Royal Statistical Society: Series B (Methodological), 57(1), 289–300. https://doi.org/10.1111/j.2517-6161.1995.tb02031.x
Brown, A. L., Myers, J., & Collins, D. (2021). How pre-service teachers’ sense of teaching efficacy and preparedness to teach impact performance during student teaching. Educational Studies, 47(1), 38–58. https://doi.org/10.1080/03055698.2019.1651696
Böwadt, P. R., & Vaaben, N. K. (2021). Ny i professionen: de første år som lærer. Københavns Professionshøjskole.
Caires, S., & Almeida, L. S. (2005). Teaching practice in Initial Teacher Education: Its impact on student teachers’ professional skills and development. Journal of Education for Teaching, 31(2), 111–120. https://doi.org/10.1080/02607470500127236
Charles, E., Metsala, J., & Specht, J. (2023). Gains in pre-service teacher efficacy for inclusive education: Contributions of initial beliefs and practicum length. International Journal of Inclusive Education, 1–18. https://doi.org/10.1080/13603116.2023.2264855
Christensen, K. B. (2013). Estimation of item parameters. In K. B. Christensen, S. Kreiner, & M. Mesbah (Eds.), Rasch models in health (pp. 49–62). ISTE & Wiley. https://doi.org/10.1002/9781118574454.ch3
Cohen, J. & Berlin, R. (2020). What constitutes an “Opportunity to Learn” in teacher preparation? Journal of Teacher Education, 71, 434–448. https://doi.org/10.1177/0022487119879893
Cox, D. R., Spjøtvoll, E., Johansen, S., van Zwet, W. R., Bithell, J. F., Barndorff-Nielsen, O., & Keuls, M. (1977). The role of significance tests [with discussion and reply]. Scandinavian Journal of Statistics, 4(2), 49–70. https://www.jstor.org/stable/4615652
Danmarks Evalueringsinstitut. (2022). Oplevelsen af praktik på uddannelserne til lærer, pædagog, sygeplejerske og socialrådgiver.
Dowle M., & Srinivasan A. (2023). data.table: Extension of 'data.frame'. https://r-datatable.com, https://Rdatatable.gitlab.io/data.table, https://github.com/Rdatatable/data.table
Elstad, E., & Christophersen, K.-A. (2017). Perceptions of digital competency among student teachers: Contributing to the development of student teachers’ instructional self-efficacy in technology-rich classrooms. Education Sciences, 7(1): 27. https://doi.org/10.3390/educsci7010027
Fischer, G. H., & Molenaar, I. W. (Eds.). (1995). Rasch models – foundations, recent developments, and applications. Springer-Verlag.
Flores, I. M. (2015). Developing preservice teachers' self-efficacy through field-based science teaching practice with elementary students. Research in Higher Education Journal, 27.
Fried, E. (2016). The 52 symptoms of major depression: Lack of content overlap among seven common depression scales. Journal of Affective Disorders, 208, 191–197. https://doi.org/10.1016/j.jad.2016.10.019
Fried, E. (2020). Corrigendum to "The 52 symptoms of major depression: lack of content overlap among seven common depression scales", [Journal of Affective Disorders, 208, 191–197]. Journal of Affective Disorders, 260, 744. https://doi.org/10.1016/j.jad.2019.05.029
Goodman, L.A., & Kruskal, W.H. (1954). Measures of Association for Cross Classifications. Journal of the American Statistical Association, 49, 732–764.
Hagquist, C., Bruce, M., & Gustavsson, J. P. (2009). Using the Rasch model in nursing research: an introduction and illustrative example. International Journal of Nursing Studies, 46(3), 380–393. https://doi.org/10.1016/j.ijnurstu.2008.10.007
Hamon, A., & Mesbah, M. (2002). Questionnaire reliability under the Rasch model. In M. Mesbah, B. F. Cole, & M-L. T. Lee (Eds.), Statistical Methods for Quality of Life Studies (pp. 155–168). Kluwer. https://doi.org/10.1007/978-1-4757-3625-0_13
Hanson, B. A. (1998). Uniform DIF and DIF defined by differences in item response functions. Journal of Educational and Behavioral Statistics, 23(3), 244253. https://www.jstor.org/stable/1165247
Haugen C. R., & Hestbek, T. A. (2015). Hensikter med lærerutdanning og ulike kunnskapsformer - Er integrasjon av pedagogikk og fagdidaktikk formålstjenlig? Utdanningsforskning.no. https://utdanningsforskning.no/artikler/2012/hensikter-med-larerutdanning-og-ulike-kunnskapsformer-er-integrasjon-av-pe-dagogikk-og-fagdidaktikk-formalstjenlig/.
Irwing, P., & Hughes, D. J. (2018). Test development. In P. Irwing, T. Booth & Hughes, D. J. (Eds.) The Wiley handbook of psychometric testing. A multidisciplinary reference on survey, scale and test development (pp.3–48). Wiley.
Karaka?, M., & Erten, ?. H. (2021). Influence of field experience on pre-service English language teacher sense of self-efficacy. ELT Research Journal, 10(1), 103–122.
Kelderman, H. (1984). Loglinear Rasch model tests. Psychometrika, 49(2), 223–245. https://doi.org/10.1007/BF02294174
Khine, M. S. & Nielsen, T. (Eds.) (2022). Academic self-efficacy: nature, measurement, and research. Springer Nature.
Kreiner, S. (2003). Introduction to DIGRAM. Department of Biostatistics, University of Copenhagen.
Kreiner, S. (2007a). Validity and objectivity: Reflections on the role and nature of Rasch models. Nordic Psychology, 59(3), 268–298. https://doi.org/10.1027/1901-2276.59.3.268
Kreiner, S. (2007b). Statistisk problemløsning. Præmisser, teknik og analyse. 2nd edition. Jurist- og Økonomforbundets forlag.
Kreiner, S. (2011). A Note on item–restscore association in Rasch Models. Applied Psychological Measurement, 35(7), 557–561. https://doi.org/10.1177/0146621611410227
Kreiner, S. (2013). The Rasch model for dichotomous items. In K. B. Christensen, S. Kreiner, & M. Mesbah (Eds.), Rasch Models in Health (pp. 5–26). ISTE & Wiley. https://doi.org/10.1002/9781118574454.ch1
Kreiner, S. & Christensen, K. B. (2002). Graphical Rasch models. In M. Mesbah, B. F. Cole, & M.-L. Ting Lee (Eds.), Statistical methods for quality of life studies (pp. 187–203). Bosten, Kluwer Academic Publishers.
Kreiner, S., & Christensen, K. B. (2004). Analysis of local dependence and multidimensionality in graphical loglinear Rasch models. Communications in Statistics-Theory and Methods, 33(6), 1239–1276.
Kreiner, S., Christensen, K. B. (2007). Validity and objectivity in health-related scales: Analysis by graphical loglinear Rasch models. In von Davier, M., & Carstensen, C. H., Multivariate and mixture distribution Rasch models (pp. 329–346). Springer. https://doi.org/10.1007/978-0-387-49839-3_21
Kreiner, S., & Christensen, K. B. (2013). Person parameter estimation and measurement in Rasch models. In K. B. Christensen, S. Kreiner, & M. Mesbah (Eds.), Rasch models in health (pp. 63–78). ISTE & Wiley. https://doi.org/10.1002/9781118574454.ch4
Kreiner, S., & Nielsen, T. (2013). Item analysis in DIGRAM 3.04. Part I: Guided tours. Research Report 2013/06. University of Copenhagen, Department of Public Health. https://ifsv.sund.ku.dk/biostat/annualreport/images/0/01/Research_Report_13-06-ny.pdf
Kreiner, S. & Nielsen, T. (2023). Item analysis in DIGRAM 5.01. Guided tours. Department of Biostatistics, University of Copenhagen. https://biostat.ku.dk/DIGRAM/Item%20analysis%20in%20DIGRAM%205-01%20-%20guided%20tours.pdf
Lauritzen, S.L. (1996). Graphical Models. Clarendon Press.
Lin, H.-L., & Gorrell, J. (2001). Exploratory analysis of pre-service teacher efficacy in Taiwan. Teaching and Teacher Education, 17, 623–635.
Marais I. (2013). Local dependence. In: K. B. Christensen, S. Kreiner, & M. Mesbah (Eds.) Rasch models in health (111–130) John Wiley & Sons, Inc.
Martins, M., Costa, J., & Onofre, M. (2015). Practicum experiences as sources of pre-service teachers’ self-efficacy. European Journal of Teacher Education, 38(2), 263–279. https://doi.org/10.1080/02619768.2014.968705
Masters, G. N. (1982). A Rasch model for partial credit scoring. Psychometrika, 47(2), 149–174. https://doi.org/10.1007/BF02296272
McDonnough, J. T., & Matkins, J. J. (2010). The role of field experience in elementary preservice teachers' self-efficacy and ability to connect research to practice. School Science and Mathematics, 110, 13–23. https://doi.org/10.1111/j.1949-8594.2009.00003.x
Mesbah, M., & Kreiner, S. (2013). The Rasch model for ordered polytomous items. In K. B. Christensen, S. Kreiner, & M. Mesbah (Eds.), Rasch models in Health (pp. 27–42). ISTE & Wiley https://doi.org/10.1002/9781118574454.ch2
Mok, Y. M., Rupp D., & Holzberger D. (2023). What kind of individual support activities in interventions foster pre-service and beginning teachers’ self-efficacy? A meta-analysis. Educational Research Review, 40, 1–18. https://doi.org/10.1016/j.edurev.2023.100552
Nielsen, T. (2021). Psychometric evaluation of the Danish language version of the Field Practice Experiences Questionnaire for teacher students (FPE-DK) using item analysis according to the Rasch model. PLOS ONE, 16(10):e0258459. https://doi.org/10.1371/journal.pone.0258459
Nielsen, T. (2024). Student teachers’ opportunities to learn through observation, own practice and feedback on the practice while in field practice placements: a graphical model approach. Frontline Learning Research, 12(1), 34–48. https://doi.org/10.14786/flr.v12i1.1347
Nielsen, T., Lindemann, D. M., Toft, L., Pettersson, M., Jensen, L. S., Nielsen, E. H. & Larsen, G. G. (2024). Teacher and teaching-related practices student teachers may have difficulty believing they can enact/engage in while in field practice: Perspectives from student teachers and teachers in field-practice schools. Nordic Studies in Education, 44(2), 103–121. https://doi.org/10.23865/nse.v44.6190
Nielsen, T., Makransky, G., Vang, M. L. & Dammeyer, J. (2017). How specific is specific self-efficacy? A construct validity study using Rasch measurement models. Studies in Educational Evaluation, 53, 87–97. https://doi.org/10.1016/j.stueduc.2017.04.003
Nielsen, T. & Santiago, P. H. R. (2020). Chapter 14: Using graphical loglinear Rasch models to investigate the construct validity of the Perceived Stress Scale. In M. Khine (Ed.) Rasch measurement: Applications in quantitative educational research (pp. 261–281). Springer Nature
Oberhuemer, P. (2014). Ausgewählte Konzepte der fachpraktischen Ausbildung in Europa. Impulse für Deutschland? Impulse für Deutschland? Eine Studie der Weiterbildungsinitiative Frühpädagogische Fachkräfte (WiFF). Mu?nchen : Deutsches Jugendinstitut 2015, 73 S. - (Ausbildung. WiFF Studien; 22) https://doi.org/10.25656/01:29055
Pajares, F. (1996). Self-efficacy beliefs in academic settings. Review of Educational Research, 66(4), 543–578. https://doi.org/10.3102/00346543066004543
Pendergast, D., Garvis, S., & Keogh, J. (2011). Pre-service student-teacher self-efficacy beliefs: An insight into the making of teachers. Australian Journal of Teacher Education, 36(12), 46–57. https://doi.org/10.14221/ajte.2011v36n12.6
Pfitzner-Eden, F. (2016). Why Do I Feel More Confident? Bandura’s Sources Predict Preservice Teachers’ Latent Changes in Teacher Self-Efficacy. Frontiers in Psychology, 7;1486. https://www.frontiersin.org/articles/10.3389/fpsyg.2016.01486
Poulsen, I., Kreiner, S. & Engberg, A.W. (2018). Validation of the early functional abilities scale: An assessment of four dimensions in early recovery after traumatic brain injury. Journal of Rehabilitation Medicine, 50(2), 165–172. https://doi.org/10.2340/16501977-2300
Rasch, G. (1960). Probabilistic models for some intelligence and attainment tests. Danish Institute for Educational Research.
Rasch, G. (1961). On general laws and the meaning of measurement in psychology. The Regents of the University of California. http://projecteuclid.org/euclid.bsmsp/1200512895
Richardson, M., Abraham, C., & Bond, R. (2012). Psychological correlates of university students' academic performance: A systematic review and meta-analysis. Psychological Bulletin, 138(2), 353–387. http://dx.doi.org/10.1037/a0026838.
Rosenbaum, P. R. (1989). Criterion-related construct validity. Psychometrika, 54(4), 625–633. https://doi.org/10.1007/BF02296400
Rots, I., Aelterman, A., Vlerick, P., & Vermeulen, K. (2007). Teacher education, graduates’ teaching commitment and entrance into the teaching profession. Teaching and Teacher Education, 23(5), 543–556. https://doi.org/10.1016/j.tate.2007.01.012
Rupp, D., & Becker, E. S. (2021). Situational fluctuations in student teachers’ self-efficacy and its relation to perceived teaching experiences and cooperating teachers’ discourse elements during the teaching practicum. Teaching and Teacher Education, 99, 103252. https://doi.org/10.1016/j.tate.2020.103252
Savasci, F., & Tuna, S. (2018). Effects of field experience and teaching practice on prospective science teachers’ self-efficacy beliefs. European Journal of Education Studies, 5(8), 232–246. http://dx.doi.org/10.5281/zenodo.2527062
Scherbaum, C. A., Cohen-Charash, Y., & Kern, M. J. (2006). Measuring general self-efficacy
A comparison of three measures using item response theory. Educational and Psychological Measurement, 66(6), 1047–1063. http://dx.doi.org/10.1177/0013164406288171.
Scholz, U., Doña, B. G., Sud, S., & Schwarzer, R. (2002). Is general self-efficacy a universal construct? Psychometric findings from 25 countries. European Journal of Psychological Assessment, 18(3), 242. http://dx.doi.org/10.1027//1015-5759.18.3.242.
Schunk, D., & Pajares, F. (2002). The development of academic self-efficacy. In A. Wigfield, & J. Eccles (Eds.), Development of achievement motivation (pp.15–31). Academic Press. http://dx.doi.org/10.1016/b978-012750053-9/50003-6.
Schwarzer, R., & Jerusalem, M. (1995). Generalized self-efficacy scale. Measures in health psychology: A user’s portfolio. Causal and Control Beliefs, 1, 35–37.
Symes W., Lazarides R., & Hußner I. (2023). The development of student teachers’ teacher self-efficacy before and during the COVID-19 pandemic. Teaching and Teacher Education, 122.https://doi.org/10.1016/j.tate.2022.103941.
Tschannen-Moran, M., & Woolfolk Hoy, A. (2001). Teacher efficacy: capturing an elusive construct. Teaching and Teacher Education, 17, 783–805. https://doi.org/10.1016/S0742-051X(01)00036-1
Warm, T. (1989). Weighted likelihood estimation of ability in item response theory. Psychometrika, 54, 427–450. https://doi.org/10.1007/BF02294627
Weber, K.E. and Greiner, F. (2019). Development of pre-service teachers' self-efficacy beliefs and attitudes towards inclusive education through first teaching experiences. Journal of Research on Special Education Needs, 19, 73–84. https://doi.org/10.1111/1471-3802.12479
Weisdorf, A. K. (2020). Læreruddannelsen i globalt perspektiv—Et komparativt studie af læreruddannelsen i Danmark, England, Finland, Holland, New Zealand, Norge, Ontario, Singapore, Sverige og Tyskland [Teacher education i a global perspective – a comparative study of teacher education in Denmark, the UK, Finland, the Netherlands, New Zealand, Norway, Ontario, Singapore, Sweden and Germany]. Danske Professionshøjskoler. https://xn--danskeprofessionshjskoler xtc.dk/wpcontent/uploads/2022/01/Laereruddannelsen-i-globalt-perspektiv.-Et-komparativt-studie.pdf
Wickham, H., Averick, M., Bryan, J., Chang, W., McGowan, L., François, R., Grolemund, G., Hayes, A., Henry, L., Hester, J., Kuhn, M., Pedersen, T., Miller, E., Bache, S., Müller, K., Ooms, J., Robinson, D., Seidel, D., Spinu, V., … Yutani, H. (2019). Welcome to the tidyverse. Journal of Open Source Software, 4(43), 1686.
Youngs, P., Elreda, L. M., Anagnostopoulos, D., Cohen, J., Drake, C. & Konstantopoulos, S. (2022). The development of ambitious instruction: How beginning elementary teachers’ preparation experiences are associated with their mathematics and English language arts instructional practices. Teaching and Teacher Education, 110, 103576. https://doi.org/10.1016/j.tate.2021.103576
For appendices see the PDF file.
