Full Html
Full Html
1. Introduction
International large-scale assessments (ILSAs), such as the Trends in International Mathematics and Science Study (TIMSS), the Programme for International Student Assessment (PISA), the Progress in International Reading Literacy Study (PIRLS), the Teaching and Learning International Survey (TALIS), and the International Civic and Citizenship Education Study (ICCS), have become invaluable resources in the global landscape of educational research and policy evaluation, providing comparative insights into student achievement, teacher practices, and educational contexts across countries. By examining educational outcomes across multiple countries, these assessments provide a unique opportunity to evaluate and compare student
Correspondence should be made to Nurullah Eryilmaz, IEA Hamburg, Hamburg, Germany. Email: nurullah.eryilmaz@iea-hamburge.de
© 2025 The Authors
knowledge, skills, and attitudes within a broad cross-national framework. ILSAs have increasingly informed educational reform efforts by identifying factors that may contribute to achievement disparities, educational equity, and the development of lifelong learning competencies (Mullis et al., 2020; OECD, 2019).
Ensuring measurement invariance is a crucial step in international large-scale assessments (ILSAs) to guarantee that constructs are interpreted consistently across different cultural and linguistic groups. Without this validation, comparisons between countries may lead to inaccurate conclusions about educational outcomes and policy implications. However, a primary methodological challenge underlying the analysis of ILSA data is the assurance of measurement invariance—a statistical property indicating that a construct holds the same meaning across diverse populations. Without achieving measurement invariance, cross-national comparisons of student, teacher, or principal responses to items can yield biased or misleading interpretations, ultimately affecting the validity of policy recommendations derived from these comparisons (Putnick & Bornstein, 2016; Rutkowski & Svetina, 2017).
There are various techniques for testing measurement invariance, one of which is Multiple-Group Confirmatory Factor Analysis (MG-CFA), a traditional method widely used in ILSA studies. MG-CFA tests invariance across hierarchical levels—configural, metric, scalar, and strict—by constraining parameters to test if the model fits comparably across groups. Configural invariance establishes that items load on the same factors across groups, metric invariance tests the equality of factor loadings, and scalar invariance further constrains item intercepts to be equal across groups. Strict invariance, the most restrictive level, additionally requires that residual variances (measurement errors) are equal across groups, ensuring that any observed differences in responses are solely due to differences in the latent construct. Despite their rigorous structure, these traditional approaches often face limitations in culturally heterogeneous settings. Specifically, achieving scalar and strict invariance in cross-national studies can be challenging due to differences in response styles, language nuances, and educational contexts that may influence how items are understood and endorsed (Eryilmaz et al., 2020; Eryilmaz & Sandoval Hernandez, 2024; Kaya et al., 2024; Davidov et al., 2014; Chen, 2008; Treviño et al., 2021; Sandoval-Hernández et al., 2019). In such cases, the need for approximate invariance—where the model allows some level of variability in item parameters—is increasingly recognized to facilitate more realistic interpretations of cross-cultural data.
To address these challenges, Asparouhov and Muthén (2014) proposed the alignment optimization method, which enables approximate measurement invariance by relaxing some constraints on item parameters. Unlike traditional approaches that necessitate strict invariance across all items, alignment optimization seeks to balance invariance and model fit by allowing for a proportion of item non-invariance while maintaining comparability. This method, also referred to as the “alignment” approach, aims to preserve the validity of latent mean comparisons across groups even when some level of non-invariance exists. Alignment optimization is particularly useful in large-scale international assessments, such as PISA, TIMSS, TALIS, PIRLS, and ICCS, where achieving full scalar invariance across culturally diverse populations is often unrealistic (Asparouhov & Muthén, 2014; Muthén & Asparouhov, 2018).
The alignment optimization approach is grounded in an exploratory multiple-group factor analysis aimed at identifying an optimal measurement invariance design. This method is most appropriate in situations where traditional approaches, such as Multiple-Group Confirmatory Factor Analysis (MG-CFA), fail to achieve full invariance due to cultural, linguistic, or contextual differences in item interpretation. Instead of requiring strict invariance, alignment optimization ensures a more flexible, yet statistically valid, approach to estimating group means and variances even when measurement invariance is only partially met. By allowing for partial non-invariance, alignment optimization enables researchers to conduct meaningful latent mean comparisons across groups, making it especially valuable in cross-national research where full comparability is often difficult to achieve.
The process involves two main stages. Initially, a configural invariance model is applied across groups, where factor loadings and intercepts are allowed to vary freely, while factor means are constrained to zero, and factor variances are fixed at one. In the second stage, factor means and variances are released, allowing the estimation of these parameters in each group without assuming full measurement invariance. This step simultaneously identifies the optimal measurement invariance pattern by incorporating a simplicity function, akin to rotation criteria in exploratory factor analysis (EFA) (Asparouhov & Muthén, 2014, p. 496).
After the alignment estimation is completed, a detailed review is conducted to identify which measurement parameters meet approximate invariance and which do not. This is achieved through both visualizations and statistical calculations of misfit in factor loadings and intercepts. To assess the reliability and quality of the alignment results, a threshold of no more than 25% non-invariance is generally recommended, as outlined by Asparouhov and Muthén (2014) and Muthén & Asparouhov (2014). Results should be interpreted cautiously: if more than 25% of parameters exhibit non-invariance, latent mean comparisons across groups may be biased, indicating that the construct may not be meaningfully comparable. Conversely, when non-invariance remains below the threshold, researchers can be more confident in the validity of cross-national comparisons. Thus, alignment optimization serves as a statistically robust alternative for addressing measurement invariance issues in educational research and international assessments where cultural and linguistic differences often pose challenges to strict invariance assumptions.
The increasing application of alignment optimization in ILSA studies has produced promising yet mixed results. For example, studies on constructs such as teaching quality, intrinsic motivation, distributed leadership, and ICT readiness have utilized alignment optimization to achieve partial or approximate invariance (Eryilmaz & Sandoval-Hernandez, 2023; Zakariya 2021), facilitating more nuanced insights across countries (Rutkowski et al., 2019; Jerrim & Micklewright, 2014). However, a critical review of these applications reveals substantial variability in the effectiveness of alignment optimization, especially when applied to culturally sensitive constructs like political trust and intrinsic motivation. This variability raises questions regarding the reliability of alignment optimization as a universal solution for invariance testing in cross-national contexts, particularly when comparing latent means of constructs that may be interpreted differently across cultural and linguistic boundaries.
This scoping review aims to map the application of alignment optimization in ILSAs, providing a comprehensive overview of its usage across different assessments, constructs, and respondent types (e.g., students, teachers, principals). By synthesizing findings from multiple studies, we seek to evaluate the practical effectiveness of alignment optimization, outline its limitations, and identify areas requiring further methodological development. Through this analysis, the review contributes to ongoing discussions regarding the robustness of alignment optimization as a tool for achieving cross-national comparability in educational research, emphasizing the need for additional empirical testing and methodological refinement to address the complex landscape of cultural and contextual variability in ILSA data.
2. Objective of the Review
The principal aim of this scoping review is to critically examine the application and efficacy of alignment optimization in addressing measurement invariance challenges within ILSAs. As alignment optimization is increasingly adopted to enhance the comparability of latent constructs across culturally and linguistically diverse contexts, understanding the breadth and effectiveness of its application is essential for refining cross-national comparisons in educational research. This review, therefore, seeks to provide a comprehensive synthesis of alignment optimization’s use across ILSAs such as the Programme for International Student Assessment (PISA), Trends in International Mathematics and Science Study (TIMSS), Teaching and Learning International Survey (TALIS), and International Civic and Citizenship Education Study (ICCS). Through this synthesis, the review aims to contribute to the broader discourse on the methodological rigor and limitations inherent in measuring complex constructs in global educational assessments.
- Summarize the Constructs and Contexts in which Alignment Optimization Has Been Utilized:
This review will provide an overview of the various constructs—ranging from teaching quality and political trust to ICT readiness and intrinsic motivation—examined in ILSAs where alignment optimization has been employed. Additionally, we will assess how alignment optimization has been applied across different respondent groups, including students, teachers, and principals, and within different survey types such as student and teacher questionnaires. By cataloging the diversity of applications, we aim to map the extent to which alignment optimization has facilitated the comparability of educational constructs across the heterogeneous cultural, linguistic, and socio-economic settings of participating countries (Asparouhov & Muthén, 2014; Rutkowski & Svetina, 2017; Eryilmaz & Sandoval-Hernandez, 2023). - Assess the Effectiveness of Alignment Optimization in Achieving Measurement Invariance Across Diverse Cultural and Linguistic Groups:
As measurement invariance is foundational for valid cross-national comparisons, it is essential to evaluate alignment optimization's success in meeting this requirement. This review will analyze the degree to which alignment optimization has succeeded in achieving configural, metric, scalar, and strict invariance for various constructs, as well as the challenges encountered in attaining these levels across multiple ILSA studies. We will scrutinize the outcomes of alignment optimization in terms of its ability to approximate invariance, thereby allowing partial non-invariance while still enabling latent mean comparisons. This objective will provide a critical assessment of alignment optimization’s effectiveness, highlighting cases where it has provided robust comparability as well as those where significant non-invariance remains (Asparouhov & Muthén, 2014; Muthén & Asparouhov, 2018; Fischer et al., 2019; Yi?iter, 2024; Kaya et al., 2024). - Identify Limitations and Challenges Associated with Alignment Optimization:
Despite its utility, alignment optimization has limitations, particularly when applied to constructs influenced by distinct cultural and linguistic factors. This review will explore common challenges faced in applying alignment optimization, including high levels of non-invariance in culturally sensitive constructs and inconsistencies in reporting non-invariance percentages across studies. The review will also examine specific methodological and practical challenges, such as the potential for interpretive bias when approximate invariance thresholds are applied. In doing so, we aim to underscore the contexts where alignment optimization may fall short and to outline the limitations researchers should consider when interpreting cross-national comparisons derived from alignment-optimized models (Rutkowski et al., 2019; Sandoval-Hernández et al., 2019; Treviño et al., 2021; Zakariya, 2021). - Provide Recommendations for Future Research and Methodological Improvements:
Building on the synthesized findings, this review will offer targeted recommendations for future research on alignment optimization in ILSAs. These recommendations will include methodological suggestions for enhancing the robustness of alignment optimization, such as integrating alternative approaches like Bayesian approximate invariance testing and utilizing machine learning to detect patterns of non-invariance. Additionally, we will advocate for improved reporting standards, including consistent documentation of non-invariance rates and clear justifications for acceptable thresholds in cross-national analyses. Furthermore, we will propose avenues for exploring alignment optimization’s applicability to less commonly studied constructs and suggest design strategies to account for cultural and linguistic influences on measurement invariance. By providing these recommendations, we aim to support the advancement of alignment optimization as a methodologically sound approach for improving the comparability of educational measures across global contexts (Muthén & Asparouhov, 2014; Wurster, 2022; Stals & Ziemes, 2024; Borgonovi & Pokropek, 2021).
In summary, this scoping review intends to present a detailed assessment of alignment optimization’s application in ILSAs, with a focus on examining its scope, effectiveness, limitations, and potential for methodological enhancement. Through this analysis, we aim to contribute to the refinement of tools for international educational research, promoting more reliable and valid cross-national comparisons that can inform educational policy and practice on a global scale.
3. Methodology
This scoping review follows the methodological framework established by Arksey and O'Malley (2005), which offers a structured approach to exploring and synthesizing research on alignment optimization in International Large-Scale Assessments (ILSAs). The review process encompasses the following stages:
1. Identifying the Research Question
The central research question guiding this review is: "How has alignment optimization been applied in ILSAs to address measurement invariance challenges?" This inquiry aims to examine the contexts, constructs, and effectiveness of alignment optimization in enhancing the comparability of educational measures across diverse cultural and linguistic groups within ILSAs. By focusing on alignment optimization's application, the review seeks to elucidate its role in overcoming the limitations of traditional measurement invariance methods, such as Multiple-Group Confirmatory Factor Analysis (MG-CFA), which often encounter difficulties in achieving full invariance in multicultural contexts.
2. Identifying Relevant Studies (Figure 1)
A comprehensive literature search was conducted across academic databases, including ERIC, PsycINFO, Web of Science, and Google Scholar. Search terms were selected to capture studies focused on alignment optimization, measurement invariance, and specific ILSAs such as TIMSS, PISA, TALIS, and ICCS. Keywords and Boolean operators were used in various combinations, including terms such as "alignment optimization," "measurement invariance," "cross-national comparability," and "large-scale assessment." The initial search was supplemented by reviewing references cited in relevant articles to identify additional studies not surfaced in the database search. The search process was iterative, with periodic adjustments to keywords and search terms as new insights emerged from preliminary results.
3. Study Selection
The selection process involved screening studies based on predetermined inclusion and exclusion criteria. Studies were eligible for inclusion if they (1) applied alignment optimization in the context of an ILSA, (2) specifically addressed issues related to measurement invariance across diverse national, cultural, or linguistic groups, (3) were published in peer-reviewed journals, and (4) were written in English. Exclusion criteria included studies focusing on alignment optimization in non-educational fields or using traditional measurement invariance techniques without integrating alignment optimization. Abstracts and titles were initially screened for relevance, followed by a full-text review to ensure each study met the inclusion criteria. This two-step screening process was designed to enhance reliability and reduce the risk of bias in study selection.
4. Charting the Data
A data extraction form was developed to systematically chart relevant information from each study. Extracted data included study characteristics (e.g., year, authorship, and publication source), constructs examined (e.g., teaching quality, intrinsic motivation, political trust, ICT readiness), ILSA survey type (e.g., student, teacher, or principal questionnaires), and the specific alignment optimization methods applied. Information on key findings related to measurement invariance levels (e.g., configural, metric, and scalar invariance) and non-invariance percentages were also recorded. The data extraction process aimed to capture both quantitative and qualitative aspects of each study, allowing for a thorough analysis of the methods and outcomes of alignment optimization in various international educational settings. By charting these variables, the review seeks to produce a structured overview that highlights patterns and differences in alignment optimization's application across constructs and assessments (see Table 1).
Identification |
Screening |
Eligibility |
Included |
Records identified through database searching: (n = 2,532) |
Records excluded using automatic filters: (n = 1,200) |
Records screened: (n = 1,332) |
Abstracts assessed for eligibility: (n = 532) |
Full texts assessed for eligibility: (n = 97) |
Records excluded: (n = 800) |
Studies contributing data: (n = 18) |
Texts excluded: (n = 435) |
Texts excluded: (n = 79) |
Figure 1.
Prisma Framework
The Studies Used in this Review
Number | Year | Study_Name | ILSA (study) | Target | MG-CFA | Alignment Optimization |
1 | 2018 | Measurement Invariance in Comparing Attitudes Toward Immigrants Among Youth Across Europe in 1999 and 2009: The Alignment Method Applied to IEA CIVED and ICCS | ICCS, CIVED | students | N/A | Below 25% |
2 | 2019 | The impact of linguistic similarity on cross-cultural comparability of students’ perceptions of teaching quality | PISA | students | N/A | Above 25% |
3 | 2020 | Teacher job satisfaction across 38 countries and economies: An alignment optimization approach to a cross-cultural mean comparison | TALIS | teachers | Metric | Above 25% |
4 | 2020 | Measurement Invariance Testing with Alignment Method: Many Groups Comparison | PISA | students | Configural | Above 25% |
5 | 2021 | Application of an innovative alignment optimisation method to a cross-cultural mean comparison of teacher self-efficacy: A cross-country study | TALIS | teachers | Metric | Above 25% |
6 | 2021 | The evolution of the association between ICT use and reading achievement in 28 countries | PISA | students | N/A | N/A (Monte-Carlo Simulation) |
7 | 2021 | Tailoring a measurement model of socioeconomic status: Applying the alignment optimization method to 15 years of PISA | PISA | students | Metric | Below 25% |
8 | 2021 | Assessing the comparability of teacher-related constructs in TIMSS 2015 across 46 education systems: an alignment optimization approach | TIMSS | teacher | Metric (for some constructs) | Below 25% (for most constructs) |
9 | 2022 | Measurement invariance of non-cognitive measures in TIMSS across countries and across time. An application and comparison of Multigroup Confirmatory Factor Analysis, Bayesian approximate measurement invariance and alignment optimization approach | TIMSS | principal, teacher and student | Configural | Above 25% (for some models) |
10 | 2022 | Testing measurement invariance of mathematics self-concept and self-efficacy in PISA using MGCFA and the alignment method | PISA | students | Metric | Above 25% |
11 | 2023 | School and Teacher Information, Communication and Technology (ICT) readiness across 57 countries: The alignment optimization method | PISA | teacher and school | N/A | Below 25% (School ICT Readiness), Above 25% (Teacher ICT Readiness) |
12 | 2023 | Is Distributed Leadership Universal? A Cross-Cultural, Comparative Approach across 40 Countries: An Alignment Optimization Approach | TALIS | principal | Metric | Below 25% |
13 | 2023 | Studying the comparability of student perceptions of teaching quality across 38 countries | TIMSS | students | Metric | Above 25% |
14 | 2024 | Cross-National Measurement of Mathematics Intrinsic Motivation: An Investigate of Measurement Invariance with MG-CFA and Alignment Method Across Fourteen Countries | TIMSS | students | Configural (4thgrade), Metric (8thgrade) | Below 25% |
15 | 2024 | Determinants of trust in order and representative institutions among adolescents across Europe: testing rational and cultural approaches | ICCS | students | Configural | Below 25% |
16 | 2024 | Political trust among European youth: Evaluating multi-dimensionality and cross-national measurement comparability | ICCS | students | Metric | Below 25% |
17 | 2024 | Measuring and explaining political tolerance among adolescents: insights from the International Civic and Citizenship Education Study2016 | ICCS | students | Configural | Below 25% |
18 | 2024 | Measurement invariance across immigrant and nonimmigrant populations on PISA non-cognitive scales | PISA | students | N/A | Above 25% |
5. Collating, Summarizing, and Reporting the Results
In the final stage, findings were synthesized thematically to address the research objectives and answer the guiding research question. Thematic analysis involved categorizing studies based on constructs, ILSA survey types, and measurement invariance outcomes. Key themes that emerged included the consistency of alignment optimization across different constructs, challenges posed by cultural and linguistic diversity, and the extent to which alignment optimization succeeded in achieving approximate measurement invariance across groups. A critical evaluation of non-invariance percentages was also conducted, with comparisons drawn between studies that achieved acceptable levels of non-invariance and those with higher levels of misalignment. This synthesis provided insights into the strengths and limitations of alignment optimization in cross-national contexts, informing recommendations for its future use and potential methodological enhancements. In reporting the results, visual aids such as summary tables and figures were employed to present the findings clearly and systematically, facilitating a deeper understanding of alignment optimization’s application across the diverse educational settings encompassed by ILSAs.
Through this structured approach, the review offers a thorough examination of alignment optimization’s role in international educational assessments, identifying methodological gaps and providing recommendations for future research to enhance the robustness and validity of cross-national comparisons in education.
4. Results
Upon reviewing the 18 studies, it was observed that five achieved configural invariance, indicating a consistent factor structure across groups. Eight studies reached metric invariance, demonstrating equal factor loadings across groups. Notably, none of the studies attained scalar invariance, which would require equal item intercepts across groups. Five studies did not report on these levels of measurement invariance.
Regarding alignment optimization results, nine studies reported non-invariance levels below the 25% threshold, suggesting acceptable cross-group comparability. In contrast, eight studies exceeded this threshold, indicating significant measurement non-invariance and potential challenges in cross-cultural comparisons. One study did not provide alignment optimization results. They evaluated alignment optimization using Monte Carlo Simulation Studies (Monte Carlo).
These findings highlight the complexities involved in achieving measurement invariance across diverse cultural contexts, underscoring the need for careful consideration when interpreting cross-national assessments. Compared to traditional MG-CFA, alignment optimization might provide a more flexible approach by allowing partial non-invariance while still enabling meaningful latent mean comparisons, making it particularly valuable in large-scale international assessments where full scalar invariance is often unattainable.
4.1 Thematic Findings from the Review of Alignment Optimization Studies
The analysis of 18 studies applying alignment optimization in ILSAs revealed several key themes regarding measurement invariance and the method’s effectiveness. These themes reflect the complexities and challenges of achieving cross-national comparability in diverse cultural and linguistic contexts.
4.1.1 Levels of Measurement Invariance Across Constructs
One of the foundational objectives of alignment optimization is to address measurement invariance at different levels—configural, metric, and scalar. These levels serve as benchmarks for the consistency of constructs across groups, such as countries or regions (see Figure 2).
- Configural Invariance: Five studies achieved configural invariance, confirming that the constructs share a similar factor structure across groups. Constructs such as teaching quality and intrinsic motivation demonstrated a consistent underlying structure across countries. This outcome provides a foundational level of comparability but is insufficient for comparing factor loadings or latent means.
- Metric Invariance: Eight studies reached metric invariance, enabling the comparison of factor loadings across groups. Constructs such as distributed leadership, teacher job satisfaction, and some dimensions of teaching quality successfully achieved this level, indicating that the relationships between items and their latent constructs were similar across contexts.
- Scalar Invariance: None of the reviewed studies attained scalar invariance. Scalar invariance requires equality in item intercepts, allowing for valid comparisons of latent means. The absence of scalar invariance across all studies highlights the significant challenges in ensuring full comparability of constructs in multicultural assessments.
- Unreported Invariance Levels: Five studies did not explicitly report on measurement invariance levels, limiting the ability to evaluate their success in addressing comparability challenges. This gap in reporting highlights the need for greater transparency in the application of alignment optimization.
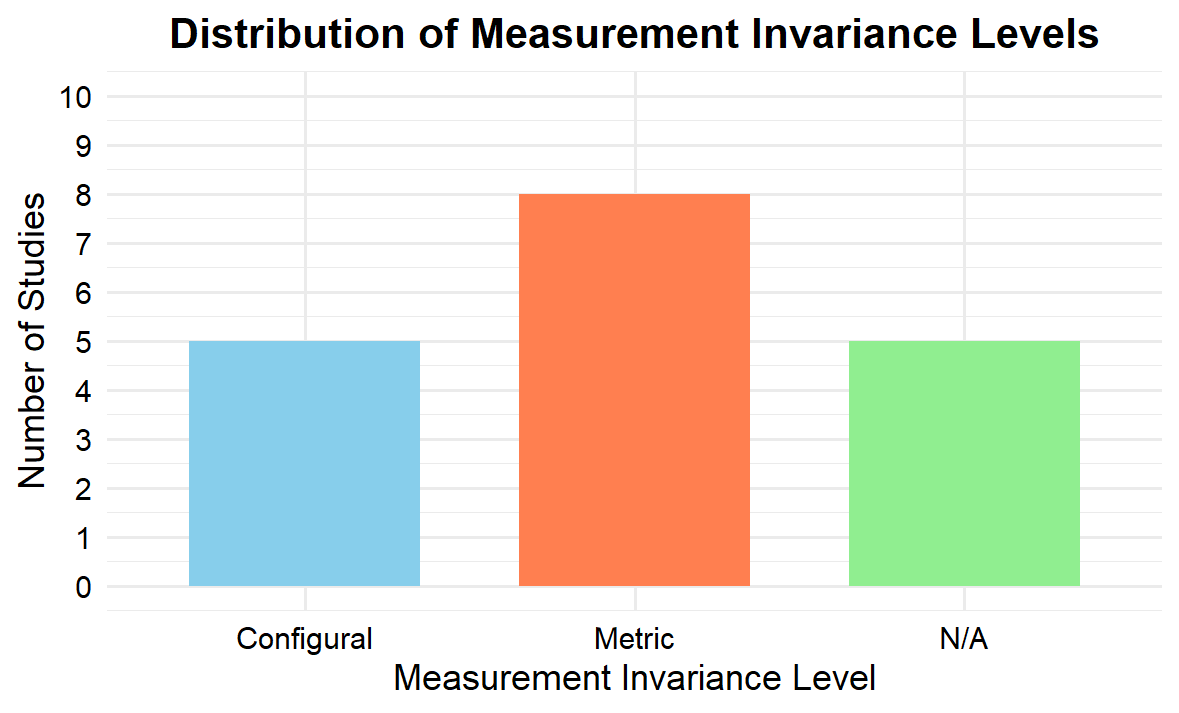
Figure 2.
The Distribution of Invariance Level
4.1.2 Alignment Optimization: Successes and Challenges
Alignment optimization has been proposed as an alternative to traditional methods, particularly in cases where scalar invariance cannot be achieved. The review of these studies provided insights into its effectiveness and limitations (see Figure 3).
- Studies Below 25% Non-Invariance Threshold: Nine studies reported alignment optimization results with non-invariance levels below the 25% threshold, suggesting acceptable cross-group comparability. For example, distributed leadership (8.75% non-invariance) and political trust (16% non-invariance) demonstrated relatively low levels of item misalignment, indicating that these constructs could be meaningfully compared across countries.
- Studies Above 25% Non-Invariance Threshold: Eight studies exceeded the 25% threshold, revealing significant challenges in achieving cross-national comparability. Constructs such as teacher self-efficacy (44% non-invariance) and teacher job satisfaction (46% non-invariance) showed high variability in how items were interpreted across cultural contexts. These findings highlight the limitations of alignment optimization in mitigating cultural and linguistic differences for certain constructs.
- Monte Carlo Simulations: One study utilized Monte Carlo simulations to explore non-invariance patterns, offering a complementary methodological approach. However, this study did not report specific non-invariance percentages, leaving some uncertainty about the effectiveness of alignment optimization in these contexts.
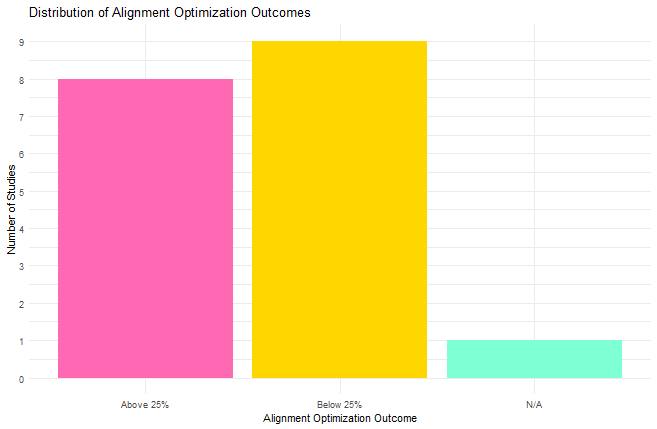
Figure 3.
The Distribution of Alignment Optimization
4.1.3 Construct-Specific Challenges
The studies covered a wide range of constructs, revealing varying degrees of success in achieving measurement invariance. There are some examples of the following constructs were included in the studies:
- Teaching Quality: Constructs related to teaching quality, such as behavioral management and instructional clarity, exhibited high non-invariance rates (49.6% and 32.9%, respectively). This suggests significant challenges in measuring these constructs consistently across countries, likely due to cultural differences in how teaching practices are perceived.
- ICT Readiness: School ICT readiness achieved below-threshold non-invariance (8%), indicating a relatively high level of comparability. In contrast, teacher ICT readiness exhibited 30.1% non-invariance, reflecting more variability in item interpretation for this construct.
- Student Belonging and Bullying: The "Sense of Belonging at School" scale was close to the 25% threshold (25.1%), while the "Bullying" scale surpassed it. These findings highlight cultural differences in how students perceive, and report experiences related to school belonging and bullying, complicating cross-national comparisons.
4.1.4 Target Groups and Assessment Contexts
The studies spanned a diverse range of target populations and assessment contexts, showcasing the versatility of alignment optimization. The following populations and studies emerged:
- Target Populations: The studies included data from students, teachers, principals, and schools. Constructs ranged from socio-emotional measures like political trust and bullying to professional measures such as teacher self-efficacy and job satisfaction. This diversity highlights the broad applicability of alignment optimization in ILSAs.
- ILSAs Represented: The studies primarily focused on well-established ILSAs, including PISA, TIMSS, TALIS, and ICCS. Each assessment brought unique challenges and opportunities for applying alignment optimization, depending on the constructs measured and the populations surveyed.
4.1.5 Cultural and Linguistic Influences
Several studies underscored the significant role of cultural and linguistic diversity in shaping alignment results.
- Linguistic Similarity: In some studies, linguistic similarity between groups improved comparability. For example, teaching quality assessments showed greater alignment when linguistic differences were minimal.
- Cultural Differences: Socio-emotional measures, such as political trust and bullying, exhibited more pronounced cultural differences. These differences often led to higher levels of non-invariance, reflecting varying interpretations of survey items across countries.
4.1.6 Methodological Variability
The studies employed a range of methodological approaches, highlighting both the potential and limitations of alignment optimization.
- Traditional vs. Alignment Optimization: Traditional MG-CFA methods often achieved configural or metric invariance but struggled with scalar invariance. Alignment optimization allowed for approximate invariance in some cases, but high non-invariance levels persisted for several constructs, particularly those influenced by cultural and linguistic factors.
- Item-Level Analysis: Some studies adopted innovative item-level analysis approaches, such as applying a 25% non-invariance threshold for individual items. This method provided a nuanced understanding of where misalignment occurred, aiding in the interpretation of results.
The review of these 18 studies reveals the complexities of achieving measurement invariance in ILSAs and the mixed effectiveness of alignment optimization. While the method shows promise in addressing cross-cultural comparability challenges, persistent issues with scalar invariance and high non-invariance levels for certain constructs highlight its limitations. The findings underscore the need for continued methodological innovation, greater transparency in reporting, and culturally sensitive approaches to improve the robustness of cross-national educational assessments.
5. Research Gap Analysis on the Use of Alignment Optimization for Cross-National and Longitudinal Comparability
The application of alignment optimization in addressing measurement invariance within International Large-Scale Assessments (ILSAs) presents both promising advancements and notable challenges. Traditional methods, such as Multi-Group Confirmatory Factor Analysis (MG-CFA), often fail to achieve scalar invariance, particularly when comparing latent constructs across diverse educational and cultural settings (Asparouhov & Muthén, 2014; Rutkowski & Svetina, 2017; Muthén & Asparouhov, 2018; Fischer et al., 2019). For instance, studies on teaching quality, mathematics intrinsic motivation, and mathematics self-concept/self-efficacy have struggled to reach full measurement invariance using MG-CFA. In response, alignment optimization has emerged as an alternative approach, allowing for approximate invariance and enabling cross-national comparisons where traditional methods fall short.
Strengths of Alignment Optimization
Alignment optimization has demonstrated effectiveness in achieving approximate invariance for certain constructs, facilitating meaningful cross-national comparisons. For example, constructs such as distributed leadership and political trust have shown low levels of non-invariance, indicating the method's utility in capturing subtle cross-cultural differences while preserving comparability (Eryilmaz & Sandoval-Hernandez, 2023; Ziemes, 2024). By permitting a degree of flexibility in parameter invariance, alignment optimization enables researchers to work with complex, multicultural datasets without excluding groups or compromising sample sizes.
Persistent Challenges and Limitations
Despite its advantages, alignment optimization is not universally effective. Studies have reported high levels of non-invariance in constructs like mathematics self-efficacy and self-concept, with non-invariance rates of 48.43% and 56.75%, respectively (Ding et al., 2023). Similarly, the Instrumental Motivation scale exhibited a 49.5% non-invariance rate, suggesting limitations in the method's ability to fully account for cross-country differences (S?rganc? et al., 2020). These discrepancies often stem from cultural and linguistic differences that influence how respondents interpret survey items and response scales (Fischer et al., 2019).
Moreover, inconsistencies in reporting alignment optimization results, such as non-invariance percentages and their implications, hinder the method’s transparency and replicability. For instance, some studies utilizing Monte Carlo simulations have omitted specific non-invariance percentages, creating gaps in understanding the full extent of alignment optimization's applicability (Borgonovi & Pokropek, 2021).
Methodological and Contextual Considerations
The effectiveness of alignment optimization varies by construct and population. Constructs related to socio-emotional factors, such as sense of belonging and bullying, are particularly susceptible to cultural nuances, complicating their alignment across countries (Casas & Sireci, 2024). Conversely, constructs with more standardized interpretations, such as ICT readiness and school emphasis on academic success, exhibit higher levels of comparability (Wu et al., 2023; Glassow et al., 2021).
Additionally, the limited representation of non-Western contexts in these studies highlights a critical gap. Most reviewed studies have focused on data from Western or developed countries, leaving open questions about how alignment optimization performs in underrepresented regions such as Africa, South Asia, and Latin America (Treviño et al., 2021).
Implications for Future Research
To advance the application of alignment optimization, researchers should consider the following:
- Diverse Item Groupings and Constructs: Investigate varied educational constructs, such as academic resilience, digital literacy, or collaborative problem-solving, across international datasets like PISA or TIMSS. Comparing constructs relevant to specific subpopulations, such as teacher leadership styles or student well-being, may reveal varying levels of invariance across cultural and linguistic groups.
- Larger and More Heterogeneous Sample Sizes: Increase participant samples by including data from more countries and larger participant pools. For example, comparing constructs like student engagement using data from over 80 countries in PISA, with participant numbers exceeding 500,000 students, would provide a more comprehensive understanding of measurement invariance across global populations. Additionally, designing studies that focus on subgroups within countries, such as urban vs. rural populations or students from different socio-economic backgrounds, can test how alignment optimization performs when comparing heterogeneous groups.
- Multiple Time Points for Longitudinal Comparisons: Expand analyses by including more time points to track changes in constructs like student motivation or teacher job satisfaction over decades. Utilizing data from PISA cycles spanning 20 years can examine how constructs evolve and test the consistency of alignment optimization over time. Conducting research that compares age cohorts longitudinally, such as analyzing educational outcomes from elementary to secondary school, can assess whether alignment optimization is sensitive to developmental changes.
- Diverse Cultural and Linguistic Contexts: Incorporate more data from underrepresented regions like Africa, South Asia, or Latin America. By using constructs measured in culturally distinct groups, researchers can better assess how alignment optimization handles diverse linguistic and cultural contexts. Conducting studies that test constructs across multiple linguistic groups within a single country, such as Canada (English and French) or Switzerland (German, French, and Italian), can reveal whether alignment optimization is robust within countries with multiple languages and cultural contexts.
- Alternative Methodologies and Hybrid Approaches: Compare alignment optimization with Bayesian methods to determine which approach better handles non-invariance issues. For instance, testing the invariance of teacher professional development constructs using both methods can compare their effectiveness. Utilizing machine learning models to identify patterns of non-invariance and predict which constructs are more likely to exhibit measurement challenges could be particularly useful in large datasets like TIMSS, with thousands of schools and teachers.
- Studies Involving Teachers and Principals: Explore invariance in constructs like teacher instructional practices or principal leadership styles using datasets like TALIS. Studies involving more than 10,000 teachers and principals across over 40 countries would allow for a comprehensive analysis of educational leadership practices.
- Use of Simulated Data for Method Comparison: Design simulation studies to test the effectiveness of alignment optimization under different conditions of non-invariance. This can help refine the method and establish clearer guidelines for its application.
6. Conclusion
Alignment optimisation has made a valuable contribution to educational measurement by providing a practical approach to address measurement invariance in International Large-Scale Assessments (ILSAs). Its significance lies in offering a more flexible alternative to traditional methods, particularly in contexts where full scalar invariance is unattainable.
The method's primary strength is its capacity to navigate the complexities of cultural and linguistic diversity inherent in ILSAs. By permitting approximate invariance, alignment optimisation enables researchers to make comparisons that would otherwise be impossible using conventional methods such as MG-CFA. However, this flexibility comes with limitations, as its effectiveness varies across constructs and contexts.
Some considerations for future developments could include developing clearer protocols for applying alignment optimisation. Researchers must establish more precise thresholds for acceptable non-invariance and adopt transparent reporting standards to enhance the method's rigour and reproducibility. This can be achieved by extending the scope of application by investigating a wider range of constructs, incorporating more geographically and culturally diverse settings, and examining longitudinal patterns in measurement invariance.
While alignment optimisation offers significant potential, it is not a universal solution. Researchers must apply the method with a clear and explicit understanding of its limitations, particularly for culturally sensitive measures. The variability in performance across constructs—ranging from relatively stable measures like ICT readiness to more complex socio-emotional dimensions—highlights the need for a context-specific approach.
Ultimately, alignment optimisation represents a critical advancement in addressing the methodological challenges of cross-national educational research. By providing a viable alternative to strict invariance testing, it allows for more meaningful comparisons in challenging contexts. However, its use demands careful interpretation, methodological rigour, and a nuanced understanding of cultural diversity.
As the field of international educational assessment evolves, alignment optimisation is set to play an increasingly central role. Advancing this approach will require ongoing research, methodological innovation, and a commitment to engaging with the complexities of both ILSA data and cultural and linguistic diversity. Researchers must remain critical and transparent in their application of this method, ensuring that cross-national comparisons are as accurate and meaningful as possible.
Funding
This research was supported by funding from the International Association for the Evaluation of Educational Achievement (IEA) Research and Development (R&D) funding program. We are deeply grateful to the IEA for providing the financial resources and institutional support that made this work possible. Their commitment to advancing educational research has been instrumental in enabling this study. We also extend my thanks to the colleagues and experts associated with the IEA for their invaluable insights and encouragement throughout the research process.
Conflict of Interest
The author(s) declared no potential conflicts of interest with respect to the research, authorship, and/or publication of this article.
Data Availability Statements
The datasets generated during and/or analyzed during the current study are available from the corresponding author on reasonable request.
How to Cite
Sandoval-Hernandez, A., Carasco, D., & Eryilmaz, N. (2025). Alignment optimization in International Large-Scale Assessments: A scoping review and future directions. Educational Methods and Psychometrics, 3: 16. https://dx.doi.org/10.61186/emp.2025.3
Manuscript Received: 21 NOV 2024
Final Version Received: 4 FEB 2025
Published Online Date: 10 FEB 2025
Appendix 1
Summary of the Studies Examined
1. Studying the comparability of student perceptions of teaching quality across 38 countries
This study examined student perceptions of teaching quality in 39 countries using data from 221,016 eighth-grade students from TIMSS 2019. Two key scales were employed: behavioral management (6 items, with response categories ranging from 0 to 3 or 4) and instructional clarity (6 items, with the same response range). To evaluate the underlying factor structure and assess cross-national comparability, a multi-group confirmatory factor analysis (MG-CFA) was conducted. Results indicated that while metric invariance was achieved, scalar invariance was not, thus preventing meaningful cross-country comparisons of mean scores.
For the behavioral management scale, an average of 49.6% of the parameters were identified as non-invariant, while the instructional clarity scale showed an average of 32.9% non-invariant parameters. Both scales had non-invariance levels exceeding the 20% threshold proposed by Asparouhov and Muthén (2022), indicating substantial variability in parameter stability across groups. This degree of non-invariance suggests significant challenges in achieving cross-cultural comparability of these scales.
2. Assessing the comparability of teacher-related constructs in TIMSS 2015 across 46 education systems: an alignment optimization approach
In the TIMSS 2019 study, which surveyed 13,508 eighth-grade mathematics teachers, several teacher-related constructs were assessed, including teacher job satisfaction, teacher self-efficacy, school emphasis on academic success, school conditions and resources, and perceptions of a safe and orderly school environment. These constructs were measured using Likert-type scales with response categories ranging from 1 to 4.
Three constructs—school emphasis on academic success, school conditions and resources, and teacher self-efficacy—achieved metric invariance, indicating that the construct measurement was consistent across groups, enabling meaningful comparisons. However, the other constructs did not achieve metric invariance, limiting cross-group interpretability.
Teacher Job Satisfaction (7 items): This construct demonstrated a low percentage of non-invariant groups (8.9%), which is well below the recommended threshold of 25% suggested by Muthén and Asparouhov (2014), indicating minimal variance in how different groups interpret the items.
School Emphasis on Academic Success (5 items): Only 7.8% of groups showed significant non-invariance, suggesting that perceptions of the emphasis on academic success were largely comparable across groups.
School Conditions and Resources (7 items): The percentage of significant non-invariance for this construct was 8.39%, again comfortably below the 25% threshold, indicating a high level of cross-group consistency in item interpretation.
Safe and Orderly School (8 items): This construct had a non-invariance rate of 9.8%, indicating that most groups consistently interpreted the items related to school safety and orderliness.
Teacher Self-Efficacy (9 items): The measure of non-invariance was 8.58%, demonstrating that teachers across groups interpreted self-efficacy items in a largely consistent manner.
3. Cross-National Measurement of Mathematics Intrinsic Motivation: An Investigation of Measurement Invariance with MG-CFA and the Alignment Method Across Fourteen Countries
In this study, we assessed the measurement invariance of the TIMSS 2019 mathematics intrinsic motivation scale, which includes nine items rated on a four-point Likert scale, across a sample of 70,192 fourth-grade students and 82,800 eighth-grade students from 14 different countries. The analysis employed Multi-Group Confirmatory Factor Analysis (MG-CFA) and the Alignment Method to evaluate the scale's invariance properties at both grade levels. Results revealed that at the fourth-grade level, the mathematics intrinsic motivation scale demonstrated only configural invariance according to MG-CFA but achieved approximate invariance through the Alignment Method. For the eighth grade, the scale met both configural and metric invariance levels according to MG-CFA, while also achieving approximate invariance with the Alignment Method (%8.7). These findings suggest that the mathematics intrinsic motivation scale supports approximate measurement invariance across countries for both grade levels, allowing for meaningful cross-national score comparisons.
4. Determinants of trust in order and representative institutions among adolescents across Europe: testing rational and cultural approaches
In the ICCS 2016 study, conducted across 15 European countries, political trust was measured using a scale comprising six items, each with four response categories. The scale achieved configural invariance when evaluated through Multi-Group Confirmatory Factor Analysis (MG-CFA), indicating a similar factor structure across countries. Using the Alignment Optimization method, non-invariance was identified in 16% of measurement patterns, suggesting minor variations in how political trust was perceived across these nations.
5. Is Distributed Leadership Universal? A Cross-Cultural, Comparative Approach across 40 Countries: An Alignment Optimisation Approach
In the TALIS 2018 study, conducted across 40 countries and involving around 8,000 principals, the distributed leadership scale consisted of 5 questions with 4 response categories. The scale was tested for cross-national comparability and reached metric level invariance, indicating consistent factor loadings across countries. This supports the reliability of examining relationships between distributed leadership and other variables. Additionally, the Alignment Optimization method revealed non-invariance in only 8.75% of the measurement patterns, well within acceptable thresholds, further affirming the validity of cross-country comparisons for this scale.
6. Measurement invariance of non-cognitive measures in TIMSS across countries and across time. An application and comparison of Multigroup Confirmatory Factor Analysis, Bayesian approximate measurement invariance and alignment optimization approach
In this study, data from the TIMSS cycles of 2007, 2011, and 2015 were analyzed across 26 countries, drawing on responses from principals, teachers, and students. The constructs analyzed included "School Emphasis on Academic Success" (from principal and teacher questionnaires), and the "Students Confident in Mathematics" (SCM) and "Students Confident in Science" (SCS) scales from the student questionnaire. These constructs met criteria for comparability over time and across a broad range of countries. For analyses spanning these cycles, a pooled dataset was utilized, with sample sizes varying depending on the specific analysis: between 105,739 and 120,315 for student data, 7665 to 8411 for teacher data, and 4117 to 4389 for principal data.
The "School Emphasis on Academic Success" construct was assessed with seven items on a five-point Likert scale, including topics such as teachers’ understanding and implementation of curricular goals, expectations for student achievement, and parental involvement and support. The SCM and SCS scales measured students' confidence in mathematics and science through four consistent items across cycles, capturing aspects of students' perceived proficiency and ease in learning these subjects. Measurement invariance analysis indicated that only configural invariance was consistently achieved across countries, with some constructs reaching metric invariance over time. The alignment optimization approach was applied, establishing approximate invariance across most countries and cycles, though about 25% of models displayed high levels of non-invariance, potentially impacting the reliability of latent mean comparisons. Future analyses may benefit from advanced computing approaches to address persistent non-invariance challenges effectively.
7. Measurement Invariance Testing with Alignment Method: Many Groups Comparison
In PISA 2015, the Instrumental Motivation scale was analyzed across 56 countries, involving 406,961 students. The scale comprised four questions, each with four response categories. Results indicated that the scale achieved configural invariance across countries, confirming a consistent factor structure. However, when evaluated through alignment optimization, measurement non-invariance was observed in 49.5% of the parameters, suggesting limitations in cross-country comparability for latent mean comparisons.
8. Measuring and explaining political tolerance among adolescents: insights from the International Civic and Citizenship Education Study2016
The ICCS 2016 study analyzed the political tolerance scale, which consisted of 6 questions rated on a 4-point Likert scale. This assessment was conducted with Grade 8 students across 15 countries. The study utilized the alignment optimization method to test for measurement invariance directly and found that 22.22% of the parameters displayed non-invariance.
9. Political trust among European youth: Evaluating multi-dimensionality and cross-national measurement comparability
The ICCS 2016 study, conducted across 15 countries with a sample of 52,788 participants, examined the political trust scale, consisting of 6 questions rated on a 4-point Likert scale. Multi-group confirmatory factor analysis (MG-CFA) indicated that the scale achieved metric level invariance. Using the alignment optimization method, 16.11% of the parameters were identified as non-invariant.
10. School and Teacher Information, Communication and Technology (ICT) readiness across 57 countries: The alignment optimization method
This study examined the measurement invariance of school and teacher Information, Communication, and Technology (ICT) readiness across 57 countries participating in the Program for International Student Assessment (PISA) 2018. The School and Teacher ICT Readiness scale is an 11-item self-reported measure with two subfactors: School ICT Readiness and Teacher ICT Readiness.
The data consisted of responses from 18,041 schools, with an average of 316 schools per country. The number of schools varied widely, from 142 in Iceland to 1,089 in Spain. The scale uses a four-point Likert-type format, where school principals rate their agreement with statements ranging from “Strongly disagree” to “Strongly agree.”
The School ICT Readiness subscale comprises five items (SC155Q01HA to SC155Q05HA) focused on infrastructure (e.g., “The number of digital devices connected to the Internet is sufficient”). The Teacher ICT Readiness subscale includes six items (SC155Q06HA to SC155Q11HA) assessing teachers’ technical and pedagogical skills (e.g., “Teachers have the necessary technical and pedagogical skills to integrate digital devices in instruction”).
Rather than conducting a Multi-Group Confirmatory Factor Analysis (MG-CFA), the study directly applied the alignment optimization method. The results showed that the School ICT Readiness subscale exhibited approximately 8% non-invariance, whereas the Teacher ICT Readiness subscale had a higher non-invariance rate of 30.1%.
11. Tailoring a measurement model of socioeconomic status: Applying the alignment optimization method to 15 years of PISA
This study analyzed data from the Swedish sample of the PISA cycles from 2000 to 2015, comprising 26,043 students, to investigate the measurement invariance of the Socio-Economic Status (SES) measure. The SES construct was assessed using five items with continuous response options.
Longitudinal analysis was conducted to determine the stability and comparability of the SES measure over time. Using Multi-Group Confirmatory Factor Analysis (MG-CFA), the SES construct achieved metric level invariance. However, when using the Alignment Optimization method, the model exhibited a non-invariance rate of 21.67%, indicating some challenges in ensuring comparability across the different cycles.
12. Testing measurement invariance of mathematics self?concept and self?efficacy in PISA using MGCFA and the alignment method
The aim of this study was to investigate the measurement invariance of mathematics self-concept (MSC) and mathematics self-efficacy (MSE) across 40 countries participating in the Programme for International Student Assessment (PISA) for the years 2003 and 2012. The sample consisted of 271,760 students in the 2003 cycle and 333,804 students in the 2012 cycle. Initially, traditional measurement invariance testing was conducted using Multi-Group Confirmatory Factor Analysis (MGCFA). Subsequently, alignment analysis was performed to allow for minimal non-invariance while estimating all parameters.
Results from MGCFA indicated that mathematics self-concept and self-efficacy achieved metric invariance across the 80 groups (i.e., country-by-cycle combinations). However, the alignment method revealed a high degree of non-invariance in both constructs, making it difficult to compare factor means reliably across all participating countries.
Mathematics Self-Efficacy (MSE): MSE in PISA was measured using eight items that reflect students' perceived abilities to solve specific mathematics problems. Students rated their confidence on a 4-point Likert scale: “very confident,” “confident,” “not very confident,” or “not at all confident.” Example tasks included “using a train timetable,” “calculating TV discounts,” and “calculating square meters of tiles.” The alignment analysis showed that 48.43% of the parameters exhibited non-invariance.
Mathematics Self-Concept (MSC): MSC was assessed using five items that capture students’ perceived competence in mathematics. Responses were collected on a 4-point Likert scale, ranging from “strongly agree” to “strongly disagree.” Example items included statements such as “I get good grades,” “I learn quickly,” and “I am not good at math.” The alignment analysis revealed that 56.75% of the parameters were non-invariant
These findings indicate significant challenges in comparing the factor means of mathematics self-concept and self-efficacy across the countries included in this study, given the high levels of non-invariance.
13. The evolution of the association between ICT use and reading achievement in 28 countries
This study analyzed data from PISA cycles 2009, 2012, 2015, and 2018 to investigate three categories of ICT use among students: ICT used for fun, ICT used for learning at home, and ICT used for learning at school. Students were asked to indicate the frequency of their engagement in various ICT-related activities using the following response options: "never or hardly ever," "once or twice a month," "once or twice a week," and "every day or almost every day."
Although the initial analysis involved reporting the percentage of non-invariance using alignment optimization, the researchers did not disclose any specific non-invariance percentages from this method. Subsequently, they employed Monte Carlo simulations to further explore the measurement properties of the ICT use scales. However, the absence of reported non-invariance percentages leaves a gap in understanding the extent of measurement invariance issues across the cycles and categories of ICT use.
14. The impact of linguistic similarity on cross-cultural comparability of students’ perceptions of teaching quality
Using PISA 2012 data, we investigated the comparability of three teaching quality dimensions: student support (5 items on a 4-point Likert scale), classroom management (5 items on a 4-point Likert scale), and cognitive activation (9 items on a 4-point Likert scale) by employing a novel psychometric method, alignment optimization. Our analysis encompassed 15 countries, grouped into five linguistic clusters, to explore the impact of linguistic similarity on data comparability.
According to Asparouhov and Muthén (2014), a maximum of 25% non-invariant item loadings and intercepts is recommended as the threshold for data comparability. If most item loadings are invariant, it becomes relatively straightforward to adhere to this limit. On the other hand, Flake and McCoach (2018) propose a guideline of 29% non-invariant item intercepts as a benchmark for meaningful mean comparisons. Given that the choice of an upper non-invariance threshold significantly affects interpretation, further research is needed to establish robust psychometric criteria for valid cross-country comparisons.
15. Measurement Invariance in Comparing Attitudes Toward Immigrants Among Youth Across Europe in 1999 and 2009: The Alignment Method Applied to IEA CIVED and ICCS
To conduct an integrated alignment analysis across CIVED99 and ICCS09, we created a pooled dataset that included student records from both studies, guided by Barber and Torney-Purta (2012). These authors reviewed and compared the frameworks and items from CIVED99 and ICCS09. Data files from all participating European countries were sourced from the IEA data repository (IEA, 2014).
Our comparative design aimed to minimize bias related to country, cohort, and gender. We incorporated data from 22 European countries in CIVED99 and 24 in ICCS09, yielding a total of 46 country samples. The target population comprised 14-year-old native-born students, with separate groups formed by gender, resulting in 92 groups (46 countries across two cohorts, separated by gender). Each group was assigned a unique identifier combining the country ISO code, the study cohort (99 or 09), and the gender of the students. The sample size totaled 79,278 students, with 18 countries participating in both studies, allowing for trend analysis between 1999 and 2009.
The “Support for Immigrants’ Rights (SIR)” scale consisted of five items using a 4-point Likert scale. Alignment analysis indicated 19.3% non-invariance across groups.
16. Teacher job satisfaction across 38 countries and economies: An alignment optimization approach to a cross-cultural mean comparison
In this analysis of teacher job satisfaction across 38 countries using TALIS 2018 data, they employed a 4-item 4 options Likert scale. The Multiple-Group Confirmatory Factor Analysis (MG-CFA) achieved metric-level invariance, indicating consistent factor loadings across countries. However, the Alignment Optimization method revealed that 46% of the parameters were non-invariant, suggesting significant differences in item intercepts or thresholds among countries. This discrepancy implies that while the construct of job satisfaction is similarly understood, the way items are interpreted or responded to varies across cultural contexts, potentially affecting the comparability of mean scores.
17. Application of an innovative alignment optimization method to a cross-cultural mean comparison of teacher self-efficacy: A cross-country study
In your analysis of the teacher self-efficacy scale from TALIS 2018 across 39 countries, you utilized a 4-item Likert scale. Applying Multiple-Group Confirmatory Factor Analysis (MG-CFA), you achieved metric-level invariance, indicating consistent factor loadings across these countries. However, the Alignment Optimization method revealed that 44% of the parameters were non-invariant, suggesting significant differences in item intercepts or thresholds among countries. This discrepancy implies that while the construct of teacher self-efficacy is similarly understood across these nations, the interpretation or response to specific items varies, potentially affecting the comparability of mean scores.
18. Measurement invariance across immigrant and nonimmigrant populations on PISA non-cognitive scales
In a study analyzing PISA student data from 31 countries, researchers examined two distinct immigrant groups, resulting in 62 groups with at least 300 immigrant students each, totaling 218,315 students. They focused on two scales: 'Sense of Belonging at School' and 'Bullying,' each comprising six items with four response options. Instead of traditional measurement invariance testing, the researchers assessed item-level non-invariance by setting a threshold of 25% for each country. On average, the 'Sense of Belonging at School' scale exhibited 25.1% non-invariance, while the 'Bullying' scale exceeded the 25% threshold, indicating higher levels of non-invariance. These findings suggest that the 'Bullying' scale may be less comparable across countries and immigrant groups, potentially due to cultural differences in interpreting survey items.
