Full Html
Enhancing Cronbach’s Alpha Applications through the Harmonised V-O-R Framework
Full Html
1. Introduction
Measurement relies on three core attributes: validity, objectivity, and reliability. While validity and objectivity are equally fundamental, reliability should emerge as a consequence of the quality of the first two. Without ensuring objectivity and validity, a test may appear reliable but fail to provide meaningful measurements.
Objectivity ensures that results are independent of both the test administrator and the respondents (Wright, 1967). It guarantees impartiality, fairness, clarity in interpretation, and minimization of biases (Wright & Stone, 1999; Gaukroger, 2012; Tristan et al., 2023). A lack of objectivity compromises result interpretability and weakens conclusions about validity.
Validity, in turn, ensures that the instrument accurately captures the construct it is designed to measure, thereby providing context and meaning to reliability. Validity must be supported by various forms of evidence, such as face, content, construct, criterion, and predictive validity. Two critical types in test design are:
- Content validity, which ensures alignment between the items and the traits being measured according to the instrument’s intended purpose.
Correspondence should be made to Agustin Tristan-Lopez, CEO of Instituto de Evaluación e Ingeniería Avanzada, San Luis Potosí, México. Honorary Research Fellow of the Imperial College, London. Email: atristan@ieia.com.mx
© 2025 The Authors
- Scale validity, which confirms that item difficulty spans the expected trait range while avoiding bias.
Content validity can be quantified (e.g., Lawshe, 1975; Tristan, 2008), while scale validity integrates directly into test design.
Reliability is only meaningful when validity and objectivity are well-established. Prioritizing reliability alone (e.g., forcing internal consistency, assuming unidimensionality, or clustering item difficulties around a single value) may create a false sense of robustness, compromising validity and introducing bias, ultimately diminishing the test’s overall utility.
This article seeks to address these issues by:
- Revisiting the theoretical basis and limitations of Cronbach’s Alpha.
- Illustrating Alpha’s behaviour through numerical examples.
- Proposing improvements using the Harmonised V-O-R Framework.
By integrating validity and objectivity into reliability assessments, the Harmonised V-O-R Framework offers an objective foundation for deriving theoretical values, replacing traditional, subjective thresholds with a more rigorous, context-dependent approach, bridging the gap between theory and practice.
2. Understanding Reliability
Reliability is a cornerstone of psychometric evaluation, ensuring consistent results and minimizing measurement errors. It encompasses internal consistency, stability over time, repeatability, and control of measurement error within acceptable limits (DeVellis, 2017; Nunnally & Bernstein, 1994). According to the Standards for Educational and Psychological Testing (AERA, APA, NCME, 2014) and other scholars (e.g., Nunnally & Bernstein, 1994; Wright & Stone, 1988), reliability is defined by two key attributes: precision (measurement accuracy) and repeatability (consistency across replications).
Both concepts originate from physics and engineering, where they apply to inanimate objects. For example, repeatedly measuring a desk’s dimensions yields consistent results, as systematic and random procedural errors can be minimised. In contrast, measuring human attributes in education, health, and social sciences introduces variability, including procedural inconsistencies, making reproducibility—particularly repeatability—more complex. For example, test-retest scores may change due to learning effects with repeated exposure, and survey responses may be influenced by contextual or subjective factors.
Reliability is typically quantified using reliability coefficients, which Wright and Stone (1988, p. 1) describe as “a generic statistic intended to quantify reliability…commonly reported for test-retest, multiple form, and split-half replications.” Essentially, reliability reflects the degree to which an instrument produces consistent measurements, free from random variations.
Internal consistency evaluates the degree to which items within a scale measure the same construct. Here, “consistency” refers to the coherence and alignment of item responses: if all items assess the same underlying trait, their responses should be highly correlated. Bohrnstedt (1969, p. 543) states, “the degree that the items are independent measures of the same construct, they will correlate with one another… Reliability assessed in this manner is called the internal consistency method.” Consistency is relevant in norm-referenced, criterion-referenced, and ipsative tests (Hughes, 2017; Martínez-Arboleda, 2021), depending on whether scores are compared against a population, a criterion, or the same individual. It applies to ability tests, surveys, high-stakes assessments, and health screening instruments, encompassing various aspects: individual score consistency across test forms, squared deviation consistency from a cutoff score, and mastery/non-mastery classification stability (Berk, 1980).
At the respondent level, consistency examines whether individuals answer items coherently. In a deterministic framework, this means correctly answering all items below one’s ability and failing all above, as described by Guttman’s scalogram model (1944). The extreme case—answering all correctly or all incorrectly—represents one end of the consistency spectrum. Stochastic models, such as the Rasch model (Wright & Stone, 1999, 2004), refine these deterministic descriptions by incorporating response variability.
Among reliability indices, Cronbach’s Alpha is the most widely used due to its simplicity and accessibility as an internal consistency measure (Novick & Lewis, 1967). However, its widespread use has led to misinterpretations. Researchers often overlook assumptions like unidimensionality or equal item variances, neglect scale validation, or interpret Alpha values without considering context and purpose.
Criticisms of Cronbach’s Alpha highlight its sensitivity to the number of items, respondent homogeneity, item difficulty distribution, and reliance on subjective thresholds to determine acceptable values of internal consistency (Cho, 2014; DeVellis, 2017; Frisbie, 1988; Raykov & Marcoulides, 2023; Schmitt, 1996; Taber, 2018; Tavakol & Dennick, 2011; Teo & Fan, 2013). Sijtsma (2009, p. 118) argues, “The only reason to report Alpha is that top journals tend to accept articles that use statistical methods that have been around for a long time such as alpha.”
Alpha’s use often leads to reliance on subjective thresholds, such as 0.7 for acceptable reliability (Taber, 2018) or 0.5 for teacher-made tests (Frisbie, 1988), with recommended values varying from 0.8 to 0.9 depending on test type and researcher preference. DeVellis (2017, p. 137) acknowledges, “I should emphasize that these are personal and subjective groupings of alpha values. I cannot defend them on strictly rational grounds. However, they reflect my experience and seem to overlap substantially with other investigators’ appraisals.”
These thresholds stem from assumptions about what reliability should be rather than an understanding of Alpha’s formula: the number of items, the sum of item variances, and total score variance. Is an Alpha of 0.7 equally reasonable for both 20-item and 120-item tests? Since Alpha is typically calculated post-administration, no theoretical a priori values are proposed, leading researchers to apply subjective cut-offs. While these thresholds are easily met in large-scale assessments, they present challenges for short tests and screening tools.
3. General Overview of Cronbach’s Alpha
For a given test, Cronbach’s Alpha represents the internal consistency of the respondents' answers (Cronbach, 1951). It provides a lower bound for all possible split-half correlations and can also be understood as the ratio between error variance and true variance. The purpose of Cronbach’s Alpha is to offer an objective parameter for evaluating how consistently individuals respond to a set of items. The formula is given as:
[1]
Where:
N: Number of items.
si2: Item’s variance. For dichotomous items: si2 = pi ´ (1 – pi)
si2: Raw score person’s variance.
Alpha measures the proportion of the total variance that is attributable to shared variance among items, serving as a proxy for internal consistency. For dichotomous items, Alpha aligns with the well-known Kuder-Richardson Formula 20 (KR-20), originally proposed by Kuder and Richardson (1937). This formula has two interpretations: first, it provides “an estimate of the percentage of the total variance that may be described as true variance, i.e., variance not due to error” (Kuder & Richardson, 1937, p. 151). Second, it represents “the average of all the split-half reliabilities or correlations between two parallel forms of a scale administered on the same occasion” (Schmidt et al., 2003).
Table 1 illustrates the calculation of Cronbach's Alpha in a scenario representative of most real-world applications, where the scale exhibits neither perfect reliability nor extreme unreliability but achieves what might be considered a reasonable level of internal consistency.
The example involves a 10-item scale designed to measure participants' attitudes toward a specific subject, using Likert-type items with five response categories coded from 1 to 5. The Total Score column represents the sum of raw scores across all items for each participant. The variance for each item (si2) and the total score variance (sx2) are calculated using standard statistical formulas.
In this case, the computed Alpha value is 0.7873, indicating a moderate level of internal consistency. This value exceeds the commonly cited threshold of 0.7, which may lead to the instrument being considered adequate under traditional reference standards, despite some potential redundancies in difficulties among the items. Although the items exhibit some degree of correlation, a detailed analysis of the variance-covariance matrix lies beyond the scope of this paper, which focuses exclusively on formula [1].
Example of the Use of Cronbach’s Alpha
Person | Item 1 | Item 2 | Item 3 | Item 4 | Item 5 | Item 6 | Item 7 | Item 8 | Item 9 | Item 10 | Total Score | |
1 | 5 | 4 | 5 | 5 | 4 | 5 | 4 | 4 | 4 | 2 | 42 | |
2 | 4 | 5 | 5 | 4 | 4 | 4 | 5 | 5 | 4 | 2 | 42 | |
3 | 2 | 4 | 5 | 2 | 4 | 2 | 4 | 4 | 3 | 2 | 32 | |
4 | 3 | 3 | 4 | 3 | 5 | 3 | 3 | 3 | 5 | 1 | 33 | |
5 | 3 | 5 | 5 | 3 | 3 | 3 | 5 | 5 | 4 | 1 | 37 | |
6 | 4 | 5 | 4 | 4 | 3 | 4 | 5 | 5 | 3 | 2 | 39 | |
7 | 3 | 3 | 4 | 3 | 5 | 3 | 3 | 3 | 3 | 1 | 31 | |
8 | 2 | 4 | 5 | 2 | 4 | 2 | 4 | 4 | 3 | 1 | 31 | |
9 | 3 | 3 | 4 | 3 | 4 | 3 | 3 | 3 | 2 | 1 | 29 | |
10 | 4 | 3 | 3 | 4 | 3 | 4 | 3 | 3 | 2 | 1 | 30 | |
sx2=24.71 | ||||||||||||
si2 | 0.90 | 0.77 | 0.49 | 0.90 | 0.54 | 0.90 | 0.77 | 0.77 | 0.90 | 0.27 | Σsi2=7.20 | |
The simplicity of Alpha comes with limitations:
- Number of Items: Alpha increases with the number of items, regardless of their quality, penalizing short scales. It can be demonstrated that, regardless of item quality, test content, or other factors, as N → ∞, α → 1, following the Spearman-Brown prophecy formula (Brown, 1910; Spearman, 1910). This often leads researchers to increase the number of items rather than focusing on high-quality, purpose-driven item selection.
- Respondent Homogeneity: Higher Alpha values can result from similar item content, difficulty, or sample issues but do not indicate item homogeneity (Cortina, 1993; Sijtsma, 2009; Tavakol & Dennick, 2011). Even with heterogeneous items, Alpha may underestimate reliability (Frisbie, 1988). Loevinger (1948) suggests alternative methods for assessing homogeneity.
- Unidimensionality Assumption: While multidimensionality is generally expected to lower Alpha, high Alpha values can still occur in multidimensional tests, just as low Alpha values may appear in unidimensional tests (Green, Lissitz & Mulaik, 1977; Sijtsma, 2009). This can lead researchers to mistakenly equate unidimensionality with homogeneity (Cortina, 1993; Panayides, 2013; Schmitt, 1996).
To address these limitations, alternative reliability models have been developed, including Generalizability Theory, Omega, Factor Analysis, Structural Equation Models, Rasch Model Separation, and simulation approaches (Brennan, 2001; Cronbach et al., 1963; Cho, 2021; Deng & Chan, 2017; Dunn et al., 2014; Foster, 2021; Green & Yang, 2009; Ogasawara, 2009; Savalei & Reise, 2019; Teo & Fan, 2013; Xiao & Hau, 2023; Wright & Stone, 1999).
Cortina (1993) outlines various interpretations of Alpha, such as its role as the mean of all possible split-half reliabilities, a measure of first-factor saturation, or a lower bound under the condition of tau-equivalence, among others. While these interpretations are justified, a deeper understanding of formula [1] and its elements provides a more effective and practical foundation for objective analysis.
4. Limits and Behaviour of Cronbach’s Alpha
Cronbach’s Alpha ranges from −∞ to 1. It is important to know this interval because most psychology texts (e.g. DeVellis, 2017; Gulliksen, 1950; Nunnally & Bernstein, 1994) traditionally state that Cronbach’s alpha ranges from 0 to 1. This assumption stems from its derivation as a ratio of variances (two non-negative values), without considering the potential influence of negative covariances. However, other authors argue that it should range from -1 to +1, based on the assumption that alpha behaves similarly to Pearson’s correlation coefficient (Warrens, 2015). It is worth noting that Cronbach himself acknowledged the occurrence of negative values and offered subjective and case-specific explanations for this phenomenon, rather than modifying the formula (Cronbach & Hartmann, 1954). The formula, as originally proposed, has since gained global acceptance and is widely used in research involving surveys and tests.
While most practical applications yield values within 0 to 1, extreme cases highlight its mathematical behaviour:
- Extreme positive values. Cronbach’s alpha close to 1 indicate perfect internal consistency of individuals' responses. While 1 is the upper limit and should be considered the benchmark for an instrument with "perfect reliability," it has always raised scepticism among evaluators, who often dismiss it as too good to be true. This concern becomes clearer when using the Rasch model or other logistic models, where each person has a set of identical responses across all items, making it impossible to measure them through the fitting of a characteristic curve. In fact, such responses are excluded in the pre-processing phase of Rasch analysis, rendering an Alpha value of 1 meaningless. It is sufficient for responses to exhibit stochastic, non-deterministic patterns across items for the logistic model to be applied, resulting in an Alpha value close to 1, but without reaching this extreme.
Table 2 illustrates a scenario where each participant responds to all items in exactly the same manner. For instance, if a participant selects category 1 on the first item, this response is replicated consistently across all items. Although this may suggest apparent homogeneity among the items, true homogeneity must be assessed using different criteria (Hollinger, 1938).
In this scenario, the items are redundant or nearly identical in terms of difficulty. They fail to define a scale that spans from low to high levels of the trait, instead concentrating around a single point on the ability scale.
The total score variance (sx2) equals N times the variance of individual items (si2), where N represents the number of items. This configuration corresponds to the maximum possible total variance, as described by Gulliksen (1950) and other classical authors, resulting in an Alpha value of 1, reflecting perfect internal consistency, highlighted by a grey shadow in some of the lines.
Table 2.
Example of a Test with Alpha = 1
Person | Item 1 | Item 2 | Item 3 | Item 4 | Item 5 | Item 6 | Item 7 | Item 8 | Item 9 | Item 10 | Total Score | |
1 | 1 | 1 | 1 | 1 | 1 | 1 | 1 | 1 | 1 | 1 | 10 | |
2 | 2 | 2 | 2 | 2 | 2 | 2 | 2 | 2 | 2 | 2 | 20 | |
3 | 1 | 1 | 1 | 1 | 1 | 1 | 1 | 1 | 1 | 1 | 10 | |
4 | 3 | 3 | 3 | 3 | 3 | 3 | 3 | 3 | 3 | 3 | 30 | |
5 | 1 | 1 | 1 | 1 | 1 | 1 | 1 | 1 | 1 | 1 | 10 | |
6 | 4 | 4 | 4 | 4 | 4 | 4 | 4 | 4 | 4 | 4 | 40 | |
7 | 5 | 5 | 5 | 5 | 5 | 5 | 5 | 5 | 5 | 5 | 50 | |
8 | 5 | 5 | 5 | 5 | 5 | 5 | 5 | 5 | 5 | 5 | 50 | |
9 | 4 | 4 | 4 | 4 | 4 | 4 | 4 | 4 | 4 | 4 | 40 | |
10 | 1 | 1 | 1 | 1 | 1 | 1 | 1 | 1 | 1 | 1 | 10 | |
sx2=290.0 | ||||||||||||
si2 | 2.90 | 2.90 | 2.90 | 2.90 | 2.90 | 2.90 | 2.90 | 2.90 | 2.90 | 2.90 | Σsi2=29.0 | |
It is evident that researchers can achieve high alpha values when all items share the same difficulty level and similar discrimination (Frisbie, 1988). While this approach may result in a reliable test, it does not necessarily satisfy validity requirements. A test focused solely on achieving high reliability values creates a problem when compared with validity. The so-called attenuation paradox highlights a non-linear relationship where reliability increases at the expense of validity, particularly regarding criterion or predictive validity. Therefore, it is recommended to prioritize establishing validity first, as emphasized in this article. Once validity is confirmed, the appropriate reliability value can be determined based on the design (Engelhard, 1993; Linacre, 1996; Loevinger, 1954). Alpha values are often considered in isolation from validity, which can create a vicious cycle with no clear resolution. In any case, it is evident that high-quality items—such as those with content validity, correct polarity, and high discrimination—can increase total score variance, thereby producing higher Alpha values (Ebel, 1967).
- Negative values. Cronbach’s Alpha can yield negative values, although this is uncommon and typically arises under specific circumstances (Cronbach & Hartmann, 1954). Negative Alpha values highlight issues with the data, such as:
- Low total score variance. When the total score variance sx2 is smaller than N times the average of the item variances (∑si2), the quotient (∑si2)/sx2 exceeds 1, resulting in a negative Alpha. This may be caused by errors in item coding, restricted response ranges, or excessive homogeneity in the sample, among other conditions mentioned below.
- Low number of items. According to formula [1], if the denominator is zero, Alpha is undetermined or diverges to -∞ when N=1. It is rare to create a test with only a single item, an instrument with few items can still have a very small total variance, as described in the first condition, leading to negative alpha values. A test with only one item is inappropriate, as it produces a standard error of measurement that tends to infinity.
- Poorly designed items: Items may lack coherence or measure entirely different constructs, resulting in inconsistent responses and diminishing internal consistency. This situation can lead to low or even inverse discrimination among the items, reflecting the poor quality of the items (Frisbie, 1988).
- Reverse-coded items not adjusted. If reverse-coded items are not properly accounted for, they can introduce negative correlations among items, leading to inconsistencies that lower Alpha.
- Small sample size of respondents: Very small datasets can exhibit unusual patterns caused by non-random noise or outliers, which may result in negative Alpha values. The lack of sufficient data amplifies the influence of random variations, leading to unreliable estimates of internal consistency.
- Multidimensionality. When a set of items measures distinct constructs or traits — for example, a test combining mathematics and history items or testlets from different domains — contrasting measures across traits can arise. Individuals may show consistency within subsets of items, with high Alpha values for each dimension, but exhibit inconsistency when a single score aggregates unrelated dimensions. Multidimensionality splits items into unrelated clusters, leading to low or negative Alpha values for the overall instrument.
- Negative item covariances. Negative covariances suggest that item responses are inversely related, often resulting from flaws in item design or the measurement of opposing constructs. Although covariance does not explicitly appear in formula [1], it is integral to Cronbach’s original derivation.
Table 3 presents the responses of students to a dichotomously coded knowledge test, which consists of two areas (or dimensions): mathematics and language, each containing five items. For the first area, the first five items are answered correctly by the first six students and incorrectly by the following four. These responses exhibit perfect internal consistency, yielding an Alpha of 1 for this area (following what was shown in Table 2). In contrast, the second area, represented by the next five items, shows responses that are internally consistent but inversely related to the first area. In this extreme case, the total score variance is effectively null, resulting in an Alpha of negative infinity.
Example of a Test with Alpha ® -¥
Area 1 (Mathematics) | Area 2 (Language) | |||||||||||
Person | Item 1 | Item 2 | Item 3 | Item 4 | Item 5 | Item 6 | Item 7 | Item 8 | Item 9 | Item 10 | Total Score | |
1 | 1 | 1 | 1 | 1 | 1 | 0 | 0 | 0 | 0 | 0 | 5 | |
2 | 1 | 1 | 1 | 1 | 1 | 0 | 0 | 0 | 0 | 0 | 5 | |
3 | 1 | 1 | 1 | 1 | 1 | 0 | 0 | 0 | 0 | 0 | 5 | |
4 | 1 | 1 | 1 | 1 | 1 | 0 | 0 | 0 | 0 | 0 | 5 | |
5 | 1 | 1 | 1 | 1 | 1 | 0 | 0 | 0 | 0 | 0 | 5 | |
6 | 1 | 1 | 1 | 1 | 1 | 0 | 0 | 0 | 0 | 0 | 5 | |
7 | 0 | 0 | 0 | 0 | 0 | 1 | 1 | 1 | 1 | 1 | 5 | |
8 | 0 | 0 | 0 | 0 | 0 | 1 | 1 | 1 | 1 | 1 | 5 | |
9 | 0 | 0 | 0 | 0 | 0 | 1 | 1 | 1 | 1 | 1 | 5 | |
10 | 0 | 0 | 0 | 0 | 0 | 1 | 1 | 1 | 1 | 1 | 5 | |
sx2=0.0 | ||||||||||||
si2 | 0.27 | 0.27 | 0.27 | 0.27 | 0.27 | 0.27 | 0.27 | 0.27 | 0.27 | 0.27 | Σsi2=2.67 | |
This situation can also occur in an instrument with Likert-type scale items, where respondents consistently select category 5 for the first area (items 1 to 5) and category 1 for the second area (items 6 to 10), or choose category 4 for the first dimension and category 2 for the second. This may indicate an issue with the polarity of the items (such as the use of negative wording in the stem or categories), which can be resolved by recoding the responses to align all items in the same direction.
Negative values are not necessarily problematic, nor do they indicate that an instrument is unusable. Instead, they signal potential issues with the scale or dataset, such as multidimensionality, item polarity and coding inconsistencies, or content relevance for representing the intended trait. These values warrant a review of the items or a reconsideration of the dataset’s suitability for analysis.
5. The Harmonised V-O-R Framework
The use of Alpha, therefore, depends on understanding the formula and defining acceptable values. Despite its wide application, the subjective thresholds proposed by researchers are often arbitrary and inappropriate. These thresholds tend to favour instruments with many items (e.g., selection tests with dozens or hundreds of items) while disadvantaging short scales (e.g., screening questionnaires in health areas), unless a set of redundant items measures the same trait with similar difficulties (Green et al., 1977; Ten Berge & Sočan, 2004).
In light of this, a comprehensive criterion is necessary to address the problem of reliability when using Cronbach’s Alpha. Rather than proposing a new formulation and accepting that Alpha is commonly used in research, evaluation and other areas, the solution lies in continuing to use Alpha while ensuring a criterion that satisfies the three essential attributes: objectivity, validity, and reliability.
With the Harmonised V-O-R Framework, it is worth considering the possibility of determining an expected reference value during the design phase. Among the three components of formula [1], the designer knows the number of items and may also have prior knowledge of item difficulties if they have been previously calibrated. Thus, the only true unknown is the variance of the raw scores. In a less favourable scenario, the designer may only know the number of items but lack data on the variances of the items or participants. To address this situation, it is essential to recall the principles outlined in the first part of this article, emphasizing objectivity and validity as prerequisites for reliability. An objective criterion can be derived using validity properties, particularly scale validity, which allows for a theoretical reference value for the sum of the variances of the items. The remaining challenge is to assume a value for the variance of the scores, based on empirical considerations.
In the context of the Validity-Objectivity-Reliability (V-O-R) framework, scale validity is indispensable. Given a specified number of items, the numerator in the formula is fixed for a uniformly distributed set of items, leaving the calculation of the total score variance (sx²) as the key variable. Under these conditions, Alpha becomes a function of the variance of participants' scores, rather than item variance. This model, prioritizing scale validity to achieve optimal reliability, was initially denominated “maximal validity – maximal reliability”, however, to avoid confusion with other generic proposals (Myers, 1962) or multivariate models using similar terminology (Conger, 1980; Drewes, 2000; Knott & Bartholomew, 1993; Penev & Raykov, 2006), it is now referred to as the “Harmonised V-O-R Framework,” reflecting a balanced and systematic approach to test design.
The Harmonised V-O-R Framework provides a structured methodology for test design and evaluation, integrating the three core attributes. Scale validity aligns the item difficulties to a test design line, ensuring uniform distribution, the framework maximizes scale validity while minimizing gaps and redundancies. Objectivity is enhanced through predictive metrics, such as theoretical Alpha values derived from item variance, given a total score variance, eliminating reliance on subjective thresholds. Reliability is directly linked to scale validity, with tools like mean absolute error (MAE) and reliability curves supporting test diagnosis and refinement.
The Harmonised V-O-R Framework is valuable in education, where balanced assessments are essential for evaluating diverse learner abilities, enabling the design of tests with a well-distributed range of difficulties, ensuring comprehensive construct coverage. Researchers can predict reliability, diagnose issues such as item clustering or score variance limitations, and improve test quality iteratively. The ideas included in the framework have been used in many practical situations, making it a versatile tool for assessments in education, health, and social sciences (for instance Céspedes, 2012; Al Qassabi et al., 2021)
According to the concept of a ruler and the principles of measurement instruments, the scale used in a test must cover the expected range of measures, with a uniform distribution of items to achieve "scale validity" following a line (Enos, 2008; Wright & Stone, 1998–2004; Linacre, 2019). To meet the requirements of scale validity, the set of items must span a reasonable interval of difficulties. For dichotomous items, these intervals could include:
- From −2 to +2 logits (or log-odd ratio units in Rasch analysis),
- From 10% to 90% of raw scores (classical test theory),
- Or another suitable interval.
For instance, an interval from −1.5 to +1.5 logits closely corresponds to probabilities ranging from p=0.1824 to p=0.8176, which can be approximated as p=0.2 to p=0.8 (20%–80%) for practical purposes, that is commonly used in practice and was suggested in the past (Horst, 1953). For instance, in a theoretical test with seven items, the design probabilities follow this distribution: p = 0.2, 0.3, 0.4, 0.5, 0.6, 0.7, and 0.8.
The Test Design Line (TDL) is a conceptual framework within Rasch measurement theory (Wright & Stone, 2004; Tristan & Vidal, 2007), where item difficulties are systematically distributed across a specified range, from low to high levels of the trait being measured, while maintaining scale validity. The primary purpose of the TDL is to provide a structured and balanced distribution of item difficulties, ensuring that the test aligns with the underlying latent trait. The concept of distributing item difficulties across the scale is not new (Horst, 1953; Myers, 1962; Richardson, 1936), and some authors have suggested using easier items to motivate respondents with weaker abilities and harder items to challenge high-ability respondents (Feldt, 1993). However, these recommendations are more subjective and fall outside the scope of the V-O-R framework. Importantly, the TDL can also be applied within the framework of the classical test theory (CTT).
To define the TDL, item difficulties are calculated using a formula that typically establishes an expected interval (measured in logits for Item Response Theory (IRT) and the Rasch model, or in percentages for CTT). This formula then uses a linear interpolation model to distribute the items evenly across this range:
 [2]
[2]
Where:
Di: Difficulty of the i-th item,
Dmin: Minimum difficulty in the interval,
Dmax: Maximum difficulty in the interval,
N: Total number of items,
i: Item number (from 1 to N).
This formula ensures a uniform distribution of item difficulties within the specified range between Dmin and Dmax, supporting scale validity. Formula [2] assumes that the interval boundaries are symmetric, meaning that the items are balanced and equidistant around a central point, with item difficulties distributed uniformly and without bias across the test. This distribution is crucial for achieving scale validity, as outlined previously and some software, like Winsteps (Linacre, 2019), reports the item measures, without a compromise to model their values in the scale. It is important to note that the TDL indicates the theoretical difficulties of a set of N items, distributed uniformly from low to high measures on the scale. However, it is not derived from the best-fitting line to the observed difficulties of the test.
To assess the quality of the test using the TDL, the observed p-values can be compared with the expected values. Discrepancies between the observed and expected values may reveal the degree of scale validity. The Mean Absolute Error (MAE) is calculated as follows:
 [3]
[3]
The MAE is preferred over squared error for its simplicity and direct alignment with logits or p-values. While complex models may exist, MAE is favoured for its practicality. An acceptable threshold is ≤ 0.05 (5%) during test design with a calibrated item bank, while ≤ 0.10 (10%) is acceptable during calibration after test administration to account for population variations (Tristan & Vidal, 2007). Higher MAE values indicate lower scale validity, reflecting an uneven item distribution, seen as gaps (missing items) or stacks (redundant items) (Baghaei, 2008; Wright & Stone, 2004). These inconsistencies suggest inadequate coverage of the intended trait, causing overemphasis on certain difficulty levels while neglecting others, undermining scale validity and precision (Baghaei, 2008).
Figure 1, based on Tables 1 and 2, illustrates that the TDL applies to both rating scale (Likert-type) and dichotomous items. As expected, both tests fail to meet scale validity within the TDL (from 0.2 to 0.8). Items are ordered by difficulty, with identification numbers next to each point.
The TDL can also be constructed using logits instead of p-values when applying the Rasch model or other IRT approaches (Wright & Stone, 2004). Some software tools transpose axes, placing measures on the horizontal axis and item numbers on the vertical. For example, Winsteps’ "Modal Observed Categories" table displays “the most probable response for an item (row) at the desired x-axis location, with items shown vertically by difficulty” (Linacre, 2019, p. 318). A transposed TDL graph appears in Example 4.
The MAE for the Likert-type questionnaire in Table 1 is 0.20, while for the dichotomous items in Table 2, it is 0.17. Table 1 data reveal significant gaps between items 10 and 1, plus two stacking levels. Table 2, however, shows redundant item distribution, yielding an MAE of 0.17 and a perfect Alpha of 1 despite lacking scale validity.
.jpg)
Test Design Line for Data of Tables 1 and 2
The Harmonised V-O-R Framework addresses the attenuation paradox by ensuring instrument validity through the objective model of the TDL. This approach leads to the expected reliability value of Alpha, maintaining relevance within the framework.
6. Application of the Harmonised V-O-R Framework in Reliability
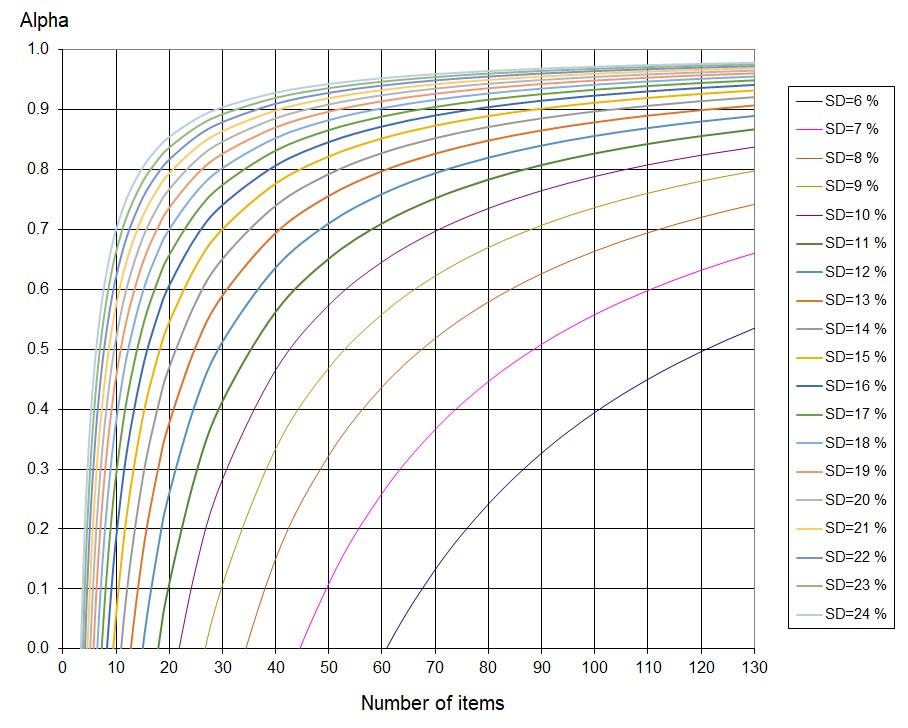
Alpha curves can be plotted for a given number of items and participant score variance (Figure 2). By normalizing the standard deviation (SD) to 100%, these curves apply across different tests, providing an objective tool for test design and evaluation in health, social sciences, and education. They help designers assess expected reliability while maintaining scale validity within the Harmonised V-O-R Framework.
This framework does not allow alternatives to the curves in Figure 2, as item difficulties must be uniformly distributed—akin to measurement marks on a ruler or thermometer (Wright & Stone, 2004). However, in a given test, the observed distribution of item difficulties might not necessarily be uniform, as it depends on the responses provided by individuals. The TDL serves as a reference without requiring users to determine a best-fit regression line. A uniform item distribution ensures full coverage of expected measures, consistent measurement error at every point on the scale, and balance around the midpoint of the theoretical design interval.
Evidently, the distribution of participants' results may follow various patterns, such as normal, bimodal, or alternative shapes, depending on the population and their abilities or opinions regarding the evaluated trait.
Theoretical Alpha Values for Tests Following the Test Design Line (TDL)
Curves are constructed for N items, distributing difficulties along the TDL. A standard deviation (SD) of respondent scores is assigned to calculate variance sx2, and formula [1] determines the corresponding Alpha value. This process is repeated for different N and sx2values and can be automated via spreadsheets or programming. According to the behaviour of the formula, all curves converge to Alpha = 1 as N→∞ and approach negative infinity as N→0.
Figure 2 demonstrates that for a test with N=90, the expected Alpha reaches 0.9 only if the standard deviation (sx) is 15%; however, if sx =10% the expected Alpha falls to 0.76, and so on. This illustrates that defining a constant reliability value for any test is inappropriate. Instead, the Harmonised V-O-R framework indicates that the reliability threshold should take both the number of items and the standard deviation into account.
Cronbach’s Alpha has a nonlinear relationship with the number of items and SD, significantly impacting tests with few items. Since Alpha does not scale proportionally and is highly sensitive to N, small changes in short tests can be misleading when viewed in relative terms. For instance, an SD increase from 11% to 12% in a 100-item test shifts Alpha from 0.827 to 0.856—a 0.029 absolute or 3.5% relative change. In contrast, with 20 items, Alpha jumps from 0.10 to 0.26—an absolute change of 0.16 or 160% relative difference. Instead of relative comparisons, confidence intervals based on the standard error should be used. The control line model (Wright & Stone, 1999) provides a more reliable approach, as shown in Example 4.
Example 1: For a Test T1 with 40 items, where participants' raw scores have a standard deviation (SD) of 4.8, what is the expected Alpha value if the items are uniformly distributed?
The SD must be expressed as a relative value, SDr, or as a percentage:
SDr = SD/N = 4.8/40 = 0.12, (or 12%).
The corresponding Alpha value of T1 is 0.63.
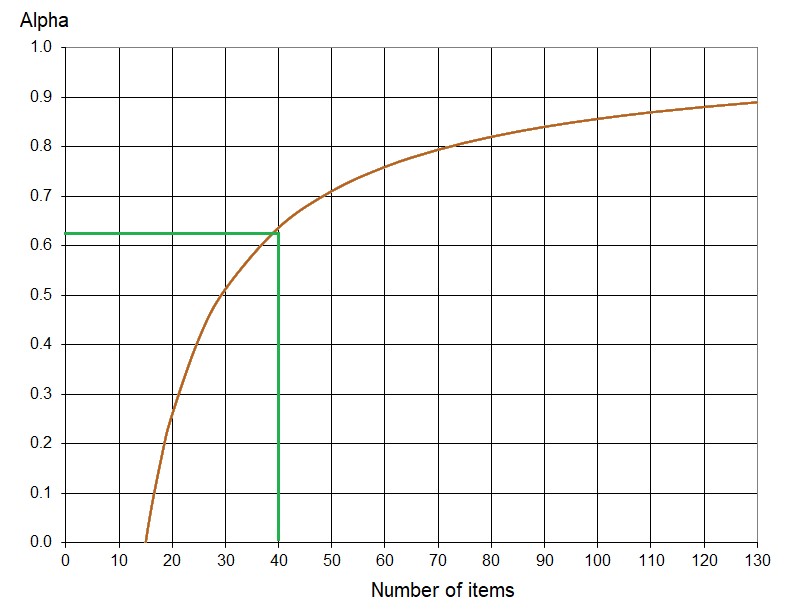
Reference Alpha for Example 1
This example demonstrates that Alpha cannot be expected to reach 0.9 unless the test lacks scale validity (i.e., the items are not uniformly distributed or fall outside the V-O-R framework), or redesigning Test T1 with more discriminating items that increases the variance of the total scores. However, 0.63 is close enough to 0.7—a common reference value—and the researcher may feel comfortable accepting this value for practical purposes.
Example 2: A Test T2 with 110 items is organized into three areas: Area 1 (Abstract Reasoning) with 20 items, Area 2 (Geometry) with 40 items, and Area 3 (Algebra) with 50 items. Each area was designed using the TDL with an MAE of 0.04 each, satisfying the Harmonised V-O-R Framework. The overall Alpha reported by the designer is 0.91. What is the expected Alpha for each area of T2 assuming they share the same standard deviation?
Referring to Figure 2, for N=110 and Alpha = 0.91, the SD corresponding to these figures is SD = 14%.
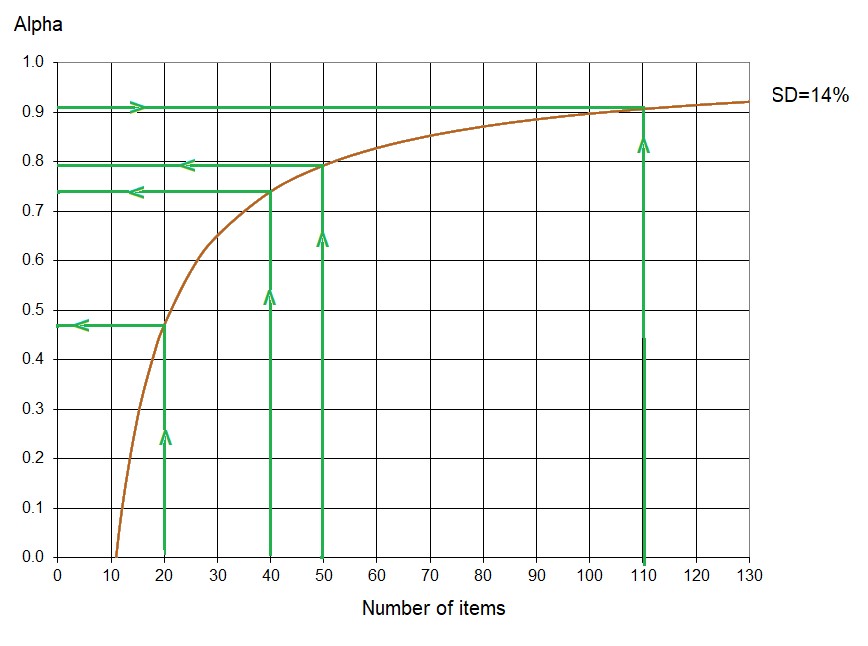
Reference Alpha Values for Each Area of the Test in Example 2
Figure 4 illustrates the Alpha values corresponding to each of the three areas in the Test T2 discussed in Example 2:
- Abstract Reasoning (20 items): Expected Alpha = 0.47
- Geometry (40 items): Expected Alpha = 0.74
- Algebra (50 items): Expected Alpha = 0.79
- Complete Test T2 (110 items): Expected Alpha= 0.91
These values assume that T2 areas share a relative SD of 14% and follow the Test Design Line (TDL). Figure 4 illustrates how Alpha varies with subtest length, showing that longer instruments yield higher values if scale validity is maintained. This challenges the idea of a fixed Alpha value (e.g., 0.7 for T2 and its areas). If areas had 35 items, theoretical Alpha would reach 0.7, meaning that 0.47 in Abstract Reasoning is not a defect, nor is 0.79 in Algebra a sign of greater reliability—both align with expected values for 20- or 50-item instruments following the TDL.
Thus, results do not imply more items are needed to raise Alpha in Abstract Reasoning or that the area is invalid for not reaching 0.7. Instead, 0.47 is the theoretical achievable Alpha for 20 items with scale validity and SD=14%, equivalent to 0.7 for 35 items of the same content, construct and scale validity. There is no objective justification for artificially altering item counts unless dictated by content weighting. Each section has an Alpha of 0.7, equivalent to a valid 35-item test, or a collective Alpha of 0.90 for 105 items.
The assumption that all areas share the same instrument standard deviation was imposed solely for illustrative purposes. In practice, SD varies across areas, and the theoretical Alpha should account for this variation. Furthermore, standard error differs among areas, as it depends on both Alpha and SD. Designers must interpret results carefully, especially when assessing achievement in criterion-referenced tests.
Example 3: Consider Test T3 with 30 items distributed according to the TDL, and a score SD of 8% for a homogeneous sample of respondents. What is the expected value of Alpha?
The curves indicate that the expected Alpha must be less than 0, implying no positive reliability can be expected due to the dispersion of participants' scores or the uniform distribution of the items. The designer has some possible solutions:
- Focus on quality of the items. High discriminating items leads to wider score differences between respondents, raising SD and improving reliability respecting the V-O-R framework. For example, if SD increases to 10%, Alpha could rise to 0.30 for the same 30 items.
- Focus on reliability without scale validity: By introducing stacks and gaps in item difficulties, the new design would yield a higher Alpha but at the cost of scale validity, not respecting the V-O-R framework.
- Focus on reliability: With 40 items and the same SD of 8%, Alpha increases to 0.16, not respecting the V-O-R framework.
Example 4: Technical report for a test. A report must present detailed data on the instrument’s general psychometric properties and its individual sections. Table 4 below displays outcomes from a certification test, emphasizing the comparison between observed and theoretical Alpha values. While a comprehensive test analysis may require a more extensive discussion, the key elements are outlined here.
Each test area was designed using item banks aligned with the Test Design Line (TDL), and the overall exam is a composite of items from these areas that should reflect the TDL. Certification approval is based on performance in the first three areas, while the remaining areas offer recommendations. This certification involved 30 voluntary candidates seeking certification; because they were not drawn from a random sample, their participation may introduce potential bias in the results.
Technical Report of a Real Certification Test.
EXAMINED CANDIDATES | 30 |
NUMBER OF ITEMS | 274 |
NUMBER OF AREAS | 25 |
HIGHEST GLOBAL PERCENTAGE ACHIEVED BY A CANDIDATE | 61.04 |
LOWEST GLOBAL PERCENTAGE ACHIEVED BY A CANDIDATE | 38.55 |
MAXIMUM NUMBER OF CORRECT RESPONSES ACHIEVED BY A CANDIDATE | 152 |
MINIMUM NUMBER OF CORRECT RESPONSES ACHIEVED BY A CANDIDATE | 96 |
(1) = Mean difficulty values outside the accepted range (45%, 55%).
(2) = Standard deviation of scores < 8%.
(3) = MAE values ≥ 10%.
(4) = Theoretical Alpha is negative or very low (< 0.10).
Area | Items | Mean Difficulty | Min. Score | Max. Score | SD | MAE % | Alpha Observed | Alpha Theoretical | SE % | |
1 | GLOBAL | 248 | 52.30 | 96 | 152 | 5.11 (2) | 6.0 | 0.708 | 0.663 | 2.76 |
2 | GENERAL ABILITIES | 126 | 54.15 | 48 | 85 | 7.80 (2) | 7.8 | 0.765 | 0.719 | 3.78 |
3 | FUNCTIONS OF THE PROFESSION | 67 | 52.98 | 23 | 48 | 9.83 (2) | 5.4 | 0.714 | 0.672 | 5.26 |
4 | BASICS OF PHARMACOLOGY | 19 | 51.17 | 5 | 12 | 10.65 | 9.1 | 0.193 | -0.006 (4) | 9.57 |
5 | MANAGEMENT | 19 | 58.49 (1) | 5 | 14 | 12.15 | 9.2 | 0.321 | 0.240 | 10.01 |
6 | PROFESSIONALISATION | 28 | 58.03 (1) | 12 | 21 | 8.50 (2) | 9.9 | 0.076 | -0.078 (4) | 8.17 |
7 | METACOGNITIVE | 24 | 61.58 (1) | 10 | 19 | 11.33 | 11.8 (3) | 0.373 | 0.307 | 8.97 |
8 | PHARMACHEMICAL PRODUCTS | 22 | 56.08 (1) | 8 | 17 | 11.37 | 7.7 | 0.336 | 0.248 | 9.26 |
9 | DEVELOPMENT OF PRODUCTS | 10 | 51.95 | 1 | 8 | 16.32 | 10.4 (3) | 0.382 | 0.221 | 12.83 |
10 | FORMULATIONS & ANALYTICS | 24 | 49.39 | 6 | 16 | 10.43 | 9.3 | 0.287 | 0.175 | 8.81 |
11 | QUALITY ASSURANCE | 21 | 62.50 (1) | 7 | 19 | 13.61 | 14.3 (3) | 0.581 | 0.465 | 8.81 |
12 | SANITARY REGULATION | 27 | 51.89 | 8 | 21 | 11.90 | 5.6 | 0.510 | 0.447 | 8.33 |
13 | DRUG REGISTRATION | 17 | 60.03 (1) | 4 | 14 | 13.31 | 12.7 (3) | 0.466 | 0.299 | 9.73 |
14 | LOGISTICS & DISTRIBUTION | 8 | 70.60 (1) | 1 | 8 | 18.37 | 20.6 (3) | 0.477 | 0.248 | 13.28 |
15 | PHARMACO-TECHNOLOGY | 12 | 41.26 (1) | 1 | 8 | 13.98 | 8.9 | 0.209 | 0.093 (4) | 12.43 |
16 | PROMOTION, MARKETING | 14 | 45.78 | 3 | 10 | 13.81 | 6.0 | 0.281 | 0.209 | 11.71 |
17 | TEACHING & RESEARCH | 15 | 45.14 | 3 | 13 | 15.14 | 6.1 | 0.457 | 0.399 | 11.16 |
18 | INFORMATICS | 11 | 55.59 (1) | 3 | 9 | 12.85 | 7.3 | -0.071 | -0.196 (4) | 13.30 |
19 | ENGLISH | 11 | 49.78 | 1 | 9 | 22.89 | 6.0 | 0.670 | 0.691 | 13.15 |
20 | UPDATING | 18 | 59.90 (1) | 7 | 15 | 11.65 | 10.9 (3) | 0.238 | 0.120 | 10.17 |
21 | RESEARCH & PRODUCTIVITY | 16 | 51.62 | 3 | 12 | 16.75 | 7.6 | 0.635 | 0.554 | 10.12 |
22 | CRITICAL THINKING | 22 | 53.83 | 7 | 15 | 11.20 | 8.3 | 0.360 | 0.223 | 8.96 |
23 | ATTITUDINAL PROFILE | 13 | 69.49 (1) | 5 | 12 | 13.58 | 19.5 (3) | 0.244 | 0.112 | 11.81 |
24 | ETHICAL PROFILE | 11 | 53.02 | 3 | 10 | 14.43 | 6.4 | 0.195 | 0.072 (4) | 12.95 |
25 | PRACTICAL CASE | 26 | 53.56 | 4 | 18 | 13.25 | 5.0 | 0.589 | 0.544 | 8.49 |
26 | ESSENTIAL ITEMS | 52 | 41.36 (1) | 13 | 28 | 6.78 (2) | 9.3 | 0.220 | 0.086 (4) | 5.99 |
Several aspects warrant discussion:
- Mean difficulty values. The expected item difficulty means should be close to 50%; however, twelve areas deviate by more than 5%, suggesting response bias.
- Score ranges and standard deviations. Five areas report SDs below 10%, while four exceed 16%. Low SDs suggest homogeneity in respondents' abilities in certain areas.
- MAE (%). Alignment with the TDL depends on individual responses. Although the test was designed for MAE ≤ 5%, this group's responses caused seven areas to exceed the 10% threshold, requiring possible actions such as reviewing items, reassessing area sets, or merging responses with another candidate group before making test design decisions. Figure 5 depicts the item distribution in Area 12: Sanitary Regulation, which closely aligns with the TDL, and extreme items are easily found.
.jpg)
Sample of TDL (Area 12)
- Alpha values. Two columns display observed and theoretical Alpha values. Three areas yield negative theoretical values, while another three fall below 0.10. Identifying areas with low theoretical Alpha values is crucial, as discrepancies stem from factors such as difficulty bias, response heterogeneity, deviations from the TDL, and item discrimination quality. Observed values consistently exceed theoretical ones throughout the test. The significance of these differences is examined below using control lines.
- Standard error %. Table presents values calculated according to the classical formula:
 [4]
[4]
Where:
SD=Standard deviation of the scores of the respondents
α=Theoretical Alpha expected value (or Alphaexpected)
The first three areas exhibit the smallest standard measurement error, in other areas, error ranges between 8% and 13%. Cut-off decisions should account for this margin. Alternatively, test designers may estimate precision using either classical standard error or IRT/Rasch-based methods.
- Control lines for Alpha. To assess the proximity between the observed Alpha value and the theoretical value derived from the Harmonised V-O-R Framework, the graph with control lines (Figure 6) is used. Given that the standard error SE is available and the population consists of 30 individuals, the confidence interval for the expected Alpha is given by:
Αlphalower = Alphaexpected – tc × SE [5a]
Alphaupper = Alphaexpected + tc × SE [5b]
Where:
Αlphalower and Alphaupper = limits of the confidence interval
tc = critical value of Student’s t-distribution for a given confidence level with n−1 degrees of freedom.
SE = standard measurement error.
A similar expression can be used by substituting tc with Zc from the normal distribution for larger samples (approximately 2 for a 95% confidence interval or 1.65 for 90% confidence in practical applications). Unlike the normal distribution, the t-distribution accounts for greater variability in smaller samples.
Figure 6 illustrates Alpha values for the areas, with theoretical values on the X-axis and observed values on the Y-axis. The dotted 45º line represents perfect equivalence between the two Alpha values. The control lines follow formulas [5a] and [5b], providing objective 90% confidence intervals for expected Alpha values. These intervals help determine whether observed values align with expected variability or indicate significant deviations. Using confidence intervals reduces the risk of misinterpretation when comparing Alpha values, especially in tests with a small number of items.
Except for the area 19 (English), all observed Alpha values are higher than the theoretical Alpha values and the majority are within the control lines, indicating a slight divergence in item distribution from what the TDL suggests. Gaps and stacks may be present in the distribution of items in each area, contributing to an increased Alpha value. Only five areas, whose IDs are shown in Figure 6, fall outside the control lines, though they are very close to the upper boundary.
The test designer can use the available information to review the items, assess scale validity, evaluate the number of items, and consider other factors to make an informed decision. The Harmonised V-O-R Framework provides a more rigorous basis for evaluation than the simplified exclusion of test areas based solely on failing to meet an arbitrary Alpha threshold, such as 0.7 or any other subjectively established criterion.
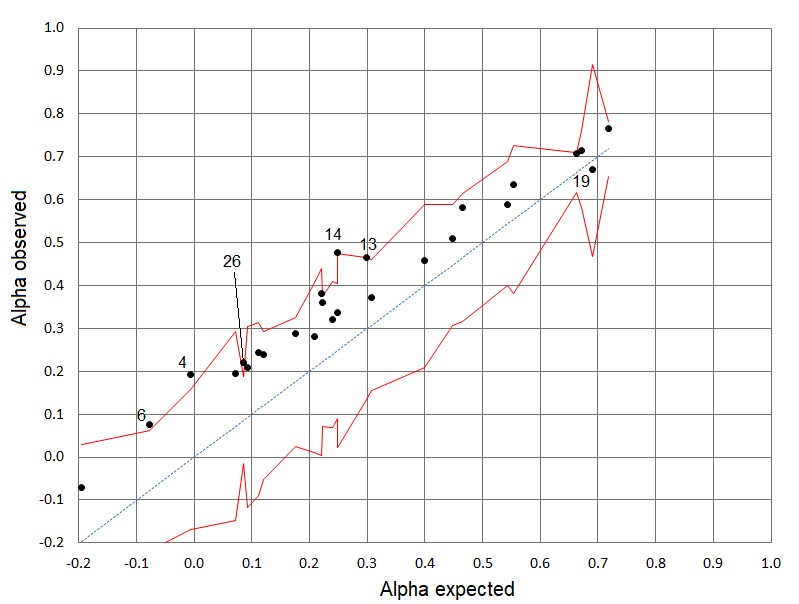
Control Lines for the Alpha Values of the Test
7. Discussion
Cronbach’s Alpha is widely used to assess internal consistency, but its sensitivity to item count, respondent homogeneity, and item difficulty distribution often leads to misleading reliability interpretations. Additionally, reliance on subjective thresholds adds inconsistency. The Harmonised Validity-Objectivity-Reliability (V-O-R) Framework addresses these issues by ensuring reliability is assessed only after establishing validity and objectivity, preventing misinterpretation of Alpha values.
A key element of this framework is the TDL, which ensures proper item distribution. Without scale validity, Alpha values are meaningless, explaining inconsistencies across studies. Alternative models like Omega, G theory, or the Rasch model refine reliability analysis, particularly for complex instruments. The Rasch model, for instance, separates item difficulty from respondent ability, offering deeper insights into item performance.
To improve reliability evaluation, this paper proposes integrating theoretical reliability curves into test design. These curves establish meaningful thresholds based on item difficulty and standard deviation of participants’ scores. Comparing observed Alpha values against these curves helps identify issues like poor item discrimination or insufficient trait coverage. This approach would enhance the robustness of reliability evaluations and ensure that tests are not only scientifically valid but also practically useful in real-world applications.
Importantly, small Alpha values do not necessarily indicate an ineffective area, as is commonly assumed (Frisbie, 1988) but rather an unfavourable combination of factors such as item count, score variance, and scale validity. Recognising these factors allows for targeted improvements. Adding redundant items may artificially increase Alpha without enhancing validity; thus, comparisons should use control lines or confidence intervals.
Unlike fixed Alpha thresholds (e.g., 0.7), the V-O-R Framework provides an objective, context-sensitive reference. A similar approach applies in the Rasch model, where separation values cannot be negative, reinforcing the importance of theoretical expectations in test design (Linacre, 1995; Tristan, 2019). Both Alpha and Rasch separation highlight the need for precise, validity-driven measurement.
8. Conclusions
Cronbach’s Alpha remains a valuable measure of reliability when applied within the Harmonised V-O-R Framework, offering a robust methodology for psychometric test design and evaluation. By ensuring scale validity through tools such as the TDL, researchers can overcome the common limitations of Alpha, enabling a more objective and accurate assessment of reliability. This framework not only enhances the understanding of test validity and reliability but also provides a clearer path for refining tests in various research contexts. While alternatives such as Omega, Generalizability Theory, and the Rasch model provide viable solutions for more complex scenarios, the Harmonised V-O-R Framework offers a scalable approach based on Alpha, making it well-suited for real-world applications across education, health, and social sciences.
The integration of validity, objectivity, and reliability in the Harmonised V-O-R Framework revolutionizes test design. By aligning item difficulties with the TDL and ensuring a uniform distribution, it maximizes scale validity while addressing common issues like item stacking or clustering and preventing distribution gaps. The inclusion of theoretical Alpha values, derived from uniform item distributions and score variances, provides objective benchmarks for assessing reliability, making the metrics more transparent and actionable. This approach allows for more refined test improvements, ensuring that reliability measures are aligned with the underlying construct. Additionally, by using diagnostic tools such as mean absolute error (MAE) and reliability curves, the framework offers clear guidance for iterative test improvement, enhancing both the precision and fairness of assessments. Ultimately, the Harmonised V-O-R Framework ensures a balanced focus on reliability, validity, and objectivity, leading to more comprehensive, rigorous, and practical assessments.
The author would like to acknowledge Mrs. Elitania Gomez for her review, and also thank the reviewers of this journal for their pertinent comments, which helped improve this article.
Software and Resources
The analyses were conducted using the commercial software Kalt® (www.ieia.com.mx) and Winsteps® (www.winsteps.com). Additionally, a Windows programme for calculating Alphaexpected and an Excel sheet for computing Alpha from the data tables in the examples are available upon request at informes@ieia.com.mx.
Conflict of Interest
No potential conflict of interest is reported by the author.
Funding
This work was supported by funding from the Instituto de Evaluación e Ingeniería Avanzada, Mexico. The funder had no role in the development of this study.
How to Cite
Tristan-Lopez, A. (2025). Enhancing Cronbach’s Alpha applications through the harmonised V-O-R framework. Educational Methods & Psychometrics, 3: 17. https://dx.doi.org/10.61186/emp.2025.4
References
Al Qassabi, K. A. H., Al Dhuhli, R. A. M., & Al Qassabi, A. K. A. (2021). Building a scale to measure the psychological effects of the COVID-19 coronavirus on Omani university students. International Journal of Educational Studies, 4(3), 81–94. https://doi.org/10.53935/2641-533x.v4i3.160
American Educational Research Association, American Psychological Association, National Council on Measurement in Education, & Joint Committee on Standards for Educational and Psychological Testing (US). (2014). Standards for educational and psychological testing. American Educational Research Association. https://www.apa.org/science/programs/testing/standards
Baghaei, P. (2008). The Rasch model as a construct validation tool. Rasch Measurement Transactions, 22(1), 1145–1146. https://www.rasch.org/rmt/rmt221a.htm
Berk, R. A. (1980). A consumer’s guide to criterion-referenced test reliability. Journal of Educational Measurement, 17(4), 323–349.
Bohrnstedt, G. W. (1969). A quick method for determining the reliability and validity of multiple-item scales. American Sociological Review, 34(4), 542–548. https://doi.org/10.2307/2091963
Brennan, R. L. (2001). Generalizability theory. Springer-Verlag.
Brown, W. (1910). Some experimental results in the correlation of mental abilities. British Journal of Psychology, 3, 296–322. https://doi.org/10.1111/j.2044-8295.1910.tb00207.x
Céspedes, V. (2012). Symptoms in women with acute coronary syndrome: From validity tests. Avances en Enfermería, 30(2), 25–38.
Cho, E. (2021). Neither Cronbach’s alpha nor McDonald’s omega: A commentary on Sijtsma and Pfadt. Psychometrika, 86, 877–886. https://doi.org/10.1007/s11336-021-09801-1
Cho, E., & Kim, S. (2014). Cronbach’s coefficient alpha: Well known but poorly understood. Organizational Research Methods. https://doi.org/10.1177/1094428114555994
Conger, A. J. (1980). Maximally reliable composites for unidimensional measures. Educational and Psychological Measurement, 40, 367–375. https://doi.org/10.1177/001316448004000213
Cortina, J. (1993). What is coefficient alpha? An examination of theory and applications. Journal of Applied Psychology, 78(1), 98–104. https://doi.org/10.1037/0021-9010.78.1.98
Cronbach, L. J. (1951). Coefficient alpha and the internal structure of tests. Psychometrika, 16(3), 297–334. https://doi.org/10.1007/BF02310555
Cronbach, L. J., & Hartmann, W. (1954). A note on negative reliabilities. Educational and Psychological Measurement, 14(2), 342–346. https://doi.org/10.1177/001316445401400213
Cronbach, L. J., Rajaratnam, N., & Gleser, G. C. (1963). Theory of generalizability: A liberalization of reliability theory. British Journal of Statistical Psychology, 16(2), 137–163. https://doi.org/10.1111/j.2044-8317.1963.tb00206.x
Deng, L., & Chan, W. (2017). Testing the difference between reliability coefficients alpha and omega. Educational and Psychological Measurement, 77, 185–203.
DeVellis, R. (2017). Scale development: Theory and applications. Sage.
Drewes, D. W. (2000). Beyond the Spearman–Brown: A structural approach to maximal reliability. Psychological Methods, 5(2), 214–227. https://doi.org/10.1037/1082-989X.5.2.214
Dunn, T. J., Baguley, T., & Brunsden, V. (2014). From alpha to omega: A practical solution to the pervasive problem of internal consistency estimation. British Journal of Psychology, 105(3), 399–412. https://doi.org/10.1111/bjop.12046
Ebel, R. L. (1967). The relation of item discrimination to test reliability. Journal of Educational Measurement, 4(3), 125–128. http://www.jstor.org/stable/1434085
Engelhard, G., Jr. (1993). What is the attenuation paradox? Rasch Measurement Transactions, 6(4), 257. https://www.rasch.org/rmt/rmt64h.htm
Enos, M. (2008). Steps leading to a straight line: Constructing a variable. Rasch Measurement Transactions, 22(1), 1155. https://www.rasch.org/rmt/rmt221f.htm
Feldt, L. S. (1993). The relationship between the distribution of item difficulties and test reliability. Applied Measurement in Education, 6(1), 37–48. https://doi.org/10.1207/s15324818ame0601_3
Foster, R. C. (2021). KR20 and KR21 for some nondichotomous data (It’s not just Cronbach’s alpha). Educational and Psychological Measurement, 81(6), 1172–1202. https://doi.org/10.1177/0013164421992535
Frisbie, D. A. (1988). Reliability of scores from teacher-made tests. Educational Measurement: Issues and Practice, 7, 25–35. https://doi.org/10.1111/j.1745-3992.1988.tb00422.x
Gaukroger, S. (2012). Objectivity: A very short introduction. Oxford University Press.
Green, S. B., Lissitz, R. W., & Mulaik, S. A. (1977). Limitations of coefficient alpha as an index of test unidimensionality. Educational and Psychological Measurement, 37, 827–836. https://doi.org/10.1177/001316447703700403
Green, S. B., & Yang, Y. (2009). Reliability of summed item scores using structural equation modeling: An alternative to coefficient alpha. Psychometrika, 74(1), 155–167. https://doi.org/10.1007/s11336-008-9099-3
Gulliksen, H. (1950). Theory of mental tests. Wiley.
Guttman, L. (1944). A basis for scaling qualitative data. American Sociological Review, 9, 139–150. https://doi.org/10.2307/2086306
Lawshe, C. H. (1975). A quantitative approach to content validity. Personnel Psychology, 28(4), 563–575. https://doi.org/10.1111/j.1744-6570.1975.tb01393.x
Linacre, J. M. (1995). Reliability and separation nomograms. Rasch Measurement Transactions, 9(2), 421. https://www.rasch.org/rmt/rmt92a.htm
Nunnally, J. C., & Bernstein, I. H. (1994). Psychometric theory (3rd ed.). McGraw-Hill.
Spearman, C. C. (1910). Correlation calculated from faulty data. British Journal of Psychology, 3, 271–295. https://doi.org/10.1111/j.2044-8295.1910.tb00206.x
Taber, K. S. (2018). The use of Cronbach’s alpha when developing and reporting research instruments in science education. Research in Science Education, 48, 1273–1296. https://doi.org/10.1007/s11165-016-9602-2
Tavakol, M., & Dennick, R. (2011). Making sense of Cronbach’s alpha. International Journal of Medical Education, 2, 53–55. https://www.ijme.net/archive/2/cronbachs-alpha/
Ten Berge, J. M. F., & Sočan, G. (2004). The greatest lower bound to the reliability of a test and the hypothesis of unidimensionality. Psychometrika, 69, 613–625. https://doi.org/10.1007/BF02289858
Teo, T., & Fan, X. (2013). Coefficient alpha and beyond: Issues and alternatives for educational research. The Asia-Pacific Education Researcher, 22, 209–213. https://doi.org/10.1007/s40299-013-0075-z
Tristan, L. A. (2008). Modification of Lawshe's model for the quantitative assessment of content validity in an objective instrument (in Spanish). Avances en Medición, 6, 35–44. http://www.humanas.unal.edu.co/psicometria/files/8413/8574/6036/Articulo4_Indice_de_validez_de_contenido_37-48.pdf
Tristan, L. A. (2019). Theoretical separation and alpha values for objective tests. Rasch Measurement Transactions, 32(3), 1725–1729. https://www.rasch.org/rmt/rmt323.pdf
Tristan, L. A., Pedraza, C. N., & Rodríguez, G. G. (2023). Objectivity: A fundamental testing attribute. Testing International, 49, June. https://www.intestcom.org/upload/media-library/ti-49-jun23-1685649465NUaRK.pdf
Tristan, L. A., & Vidal, U. R. (2007). Linear model to assess the scale’s validity of a test. AERA Meeting 2007. ERIC ED501232. http://www.eric.ed.gov/PDFS/ED501232.pdf
Warrens, M. J. (2015). On Cronbach’s alpha as the mean of all split-half reliabilities. In R. Millsap, D. Bolt, L. van der Ark, & W. C. Wang (Eds.), Quantitative psychology research (Vol. 89, pp. 123–133). Springer. https://doi.org/10.1007/978-3-319-07503-7_18
Wright, B. D. (1967). Sample-free test calibration and person measurement. MESA Research Memorandum Number 1, October 28. https://www.rasch.org/memo1.htm
Wright, B. D., & Stone, M. H. (1988). Reliability in Rasch measurement. Research Memorandum No. 53. MESA Psychometric Laboratory. https://www.rasch.org/measess/met-19.pdf
Wright, B. D., & Stone, M. H. (1999). Measurement essentials. Wide Range, Inc. https://www.rasch.org/measess/me-all.pdf
Wright, B. D., & Stone, M. H. (2004). Making measures. The Phaneron Press.
Xiao, L., & Hau, K.-T. (2023). Performance of coefficient alpha and its alternatives: Effects of different types of non-normality. Educational and Psychological Measurement, 83(1), 5–27. https://doi.org/10.1177/00131644221088240
