Full Html
Full Html
1. Introduction
Statistics courses are mandatory in many social science study programs, including psychology.
Such courses are indispensable for a thorough scientific training in the empirical behavioural sciences. Unfortunately, many students experience anxiety in relation to learning statistics, i.e. statistical anxiety (Baloǧlu, 2003; Onwuegbuzie & Wilson, 2003), and this can pose a problem for both the students and instructors of statistics courses (Chew & Dillon, 2014; Ralston et al., 2016). Cruise et al. (1985) defined statistics anxiety as “the feeling of anxiety encountered when taking a statistics course or doing statistical analysis” (p. 92), while Zeidner (1991) described statistical anxiety more in depth as”… a particular form of performance anxiety characterised by extensive worry, intrusive thoughts, mental disorganisation, tension, and physiological arousal”. (p. 319)
Statistical anxiety in higher education has been linked to inadequate learning behaviour in students (e.g., Macher et al., 2011; Onwuegbuzie, 2004) and to both poorer academic outcomes (e.g., Kesici et al., 2011; Macher et al., 2011, 2013) and better exam results (e.g., Hunt et al., 2023). Similarly, positive attitudes towards statistics have been linked to high course grades (e.g., Fullerton & Umphrey, 2002), as non-related to statistical anxiety (e.g., Macher et al., 2011), and as a mediator of statistical anxiety (e.g., Sesé et al., 2015). Thus, while previous research does not point clearly to the consequences of statistical anxiety and/or attitudes towards statistics as being negative or positive in relation to learning and training in mandatory areas such as statistics in psychology education as problematic in itself. In any case, high arousal and a state of alert in the student body within a discipline do not enhance the learning environment or the well-being of students.
Several instruments have been suggested for measuring statistical anxiety and attitudes towards statistics, including the Statistical Anxiety Rating Scale (STARS; Cruise & Wilkins, 1980; Cruise et al., 1985), the Attitude Towards Statistics scale (ATS; Wise, 1985) and the Survey of Attitudes Towards Statistics (SATS; Schau et al., 1995). These instruments are all rather dated when considering the progress in opportunities to learn and work with statistics within higher education courses, e.g., on one's own laptop rather than in a laboratory, with open-source statistical software, or with support of an abundance of online help and tutorials. In this study, the newer Attitudes and Relationship to Statistics - Revised (Original Danish name “Holdninger og Forhold til Statistik”, HFS-R; Nielsen & Kreiner, 2018; 2021a; 2021b) instrument for measuring both statistical anxiety and attitudes towards statistics will be investigated. The FHS-R not only measures overall statistics anxiety, but also subtypes of this with particular relevance for the classroom context in higher education, such as test and classroom anxiety, interpretation anxiety, fear of asking for help, and attitudes towards worth of statistics for the academic discipline and future career.
The HFS-R has previously been studied in its original Danish version (FHS-R-DK; Nielsen & Kreiner, 2018; 2021a; 2021b), while studies with an English translation and a Ukrainian translation are ongoing in research groups in the UK and Germany, respectively. In this study, we investigate a German translation (HFS-R-G), as it compares to the Danish original version, administered to psychology students in the German-speaking part of Switzerland.
When an instrument, like the HFS-R, is translated into different languages, it is important to investigate for violations of measurement invariance before comparing the results across language forms (Merenda, 2005). In the validation of instruments by means of Rasch models (Rasch, 1960) items are routinely tested for differential item functioning (DIF; Holland & Wainer, 1993) to detect items that have different measurement properties for different subgroups of participants, as well as invariance of the total set of items in a scale across subgroups.
The current study is the first validity study investigating the measurement properties of the German language version of the HFS-R by comparative item analyses of a subsample of students from Zurich, in the German-speaking part of Switzerland, who completed the German language version, to a Danish subsample of students, who completed the original Danish language version. To fulfil this aim, we conducted extensive item analyses of the subscales in both languages focusing specifically on the issue of comparability across the two language versions (i.e. differential item functioning and overall invariance).
2. Methods
2.1 Instrument
The HFS-R questionnaire (In Danish: Holdninger og Forhold til Statistik – Revideret; Nielsen & Kreiner, 2021b) measures statistical anxiety as well as attitudes towards statistics. The HFS-R was developed and first validated in Danish (Nielsen & Kreiner, 2018) on the basis of a translation of the Statistical Anxiety Rating Scale (STARS; Cruise & Wilkins, 1980; Cruise et al., 1985). For details on how the HFS-R relates to the STARS, see Nielsen and Kreiner (2018). A second validity study has also been conducted in the Danish context (Nielsen & Kreiner, 2021a).
The HFS-R consists of 26 items comprising three subscales measuring anxiety and one subscale measuring attitudes: the Test and Class Anxiety scale (TCA) with seven items, the Interpretation Anxiety scale (IA) with eight items, the Fear of Asking for Help scale (FAH) with five items, and the Worth of Statistics scale (WS) with six items. For the three anxiety subscales, students rate the items according to the degree of anxiety they would experience in the described situations related to their statistics course using a four-point response scale: 1 = no anxiety, 2 = a little anxiety, 3 = some anxiety, and 4 = a lot of anxiety. For the attitude subscale, students are asked to state their agreement with each item statement using another four-point response scale: 1 = definitely disagree, 2 = disagree more than agree, 3 = agree more than disagree, and 4 = definitely agree.
For this study, the HFS-R was translated into German. The Danish version served as a basis for translating the HFS-R items, while an unvalidated English translation was used to clarify the meaning of items in the translation process. Two independent translations were done and systematically compared. Discrepancies were rigorously discussed to obtain a consensus version that all translators agreed upon . All translators had a very good understanding of English. Three of the translators were native German speakers, one of which had a good understanding of Danish, and one had a good understanding of German while being a native Danish speaker. The items are shown in both Danish and German in the Appendix (Table A1).
2.2 Participants and data samples
All participants were university students enrolled in psychology programs and taking statistics courses within these programs (Table 1). In total, the data sample comprised 813 students; 445 Danish students and 368 Swiss students. The Danish subsample was collected during 2018-2019, while the Swiss subsample was collected in 2021.
The Danish subsample consisted of students from one Danish university taking statistics courses within the Bachelor of Psychology degree program. The courses were a first-semester and a second-semester statistics course, both consisting of a weekly lecture and small-group exercise classes. The Danish data were collected in the fifth lecture of the respective courses, thus one month into the first or the second semester of the degree program. Data were collected using a paper-and-pencil version of the Danish language version of the HFS-R questionnaire, including a number of demographic and other background questions. Students had been informed of the data collection in advance and that it was voluntary to participate. Time had been allowed for data collection within the specific lectures, specifically 15 minutes at the end of the first half of the lecture. At the time of the data collection, students were informed of the purpose of the overall project (i.e. to investigate statistical anxiety and attitudes towards statistics, including conducting various types of validity studies), that their data would be treated according to the prevailing data protection regulations, that they could ask to have data deleted until data had been anonymized, and that participation was voluntary. Students were provided the same information in writing as well as contact information for the principal investigator.
In the Danish subsample, some students completed the survey only once, while some students completed the survey twice: 173 were enrolled in a first-semester course, and responded only once to the survey. Of these, 164 responded that this was their first statistics course within higher education, while nine responded that it was not. One hundred and fifty were enrolled in a second semester statistics course and responded only once to the survey. As the second-semester course required completion of the first-semester course, these students were not taking their first statistics course within higher education. One hundred and sixty-seven students responded in both their first-semester course and their second-semester course. Of these, six responded in the first semester that this was not their first statistics course in higher education. The remaining 161 cases were assigned randomly to represent either the group of students taking their first statistics course or the group not taking their first statistics course in the data sample, respectively. The resulting Danish data sample thus consisted of 445 students, with 55.5% taking their first statistics course in higher education and the remaining 44.5% taking a statistics course that was not their first. The Danish students were, on average, 22.9 years old (SD = 5.27) and mostly female (72.6%).
Similar to the Danish sample, the Swiss data were collected in the fifth lecture of statistics courses in the Bachelor of Psychology degree program. The courses were an introductory statistics course without computer exercises for 1st semester students (as well as students repeating the class one year later), an introduction to statistical software for 3rd semester students, and an intermediate-level statistics course for 5th semester students. All three courses were mandatory. Accordingly, the Swiss subsample consisted of psychology students either in their 1st, 3rd or 5th semester. In the lectures, the purpose of the study was briefly introduced in the last 15 minutes of the lecture, and students were then given access to the survey though a link to an online survey hosted by Limesurvey (LimeSurvey GmbH. (n.d.). The survey collected the socio-demographic information of the participants as well as some background questions (see Table 1) before showing the HSF-R items. Students were given 10 minutes time to reply to the survey using their private laptops or the cell-phones. The Swiss students only completed the survey once. In total, N = 368 students completed the HSF-R, and they were, on average, 22.6 years old (SD = 4.52) and mostly female (79.3%). The Swiss data sample consisted of 38% students, who were taking their first statistics course while the majority were taking a statistics course, which was not their first.
Only 7.6% of the Swiss students found that statistics were not relevant for their future employment. This percentage was notably lower than in the Danish sample, where 16.9% found that they would not be needing statistics for their future employment. The majority of the Swiss students deemed their mathematics level as adequate or more than adequate for learning statistics (88%), and the same was the case for the Danish students (74.6%).
Table 1.
Characteristics of the Total Sample and the Danish and Swiss Subsamples
Total sample (N = 813) | Swiss subsample (n=368) | Danish subsample (n=445) | |||||||
n | % | n | % | n | % | ||||
More than adequate | 104 | 12.8 | 52 | 14.1 | 52 | 11.7 | |||
Adequate | 552 | 67.9 | 272 | 73.9 | 280 | 62.9 | |||
Not quite adequate | 99 | 12.2 | 41 | 11.1 | 58 | 13 | |||
Entirely inadequate | 8 | 1.0 | 3 | 0.8 | 5 | 1.1 | |||
Expectancy to need statistics in future employment | n | % | n | % | n | % | |||
Yes | 288 | 35.4 | 178 | 48.4 | 110 | 24.7 | |||
Maybe | 411 | 50.6 | 160 | 43.5 | 251 | 56.4 | |||
No | 103 | 12.7 | 28 | 7.6 | 75 | 16.9 | |||
Statistics course at university level | n | % | n | % | n | % | |||
1st statistics course | 387 | 47.6 | 140 | 38.0 | 247 | 55.5 | |||
Not 1st statistics course | 426 | 52.4 | 228 | 62.0 | 198 | 44.5 | |||
Statistics course placement in degree program | n | % | n | % | n | % | |||
1st semester | 386 | 47.5 | 130 | 35.3 | 256 | 57.5 | |||
2nd semester | 189 | 42.5 | - | - | 189 | 42.5 | |||
3rd semester | 113 | 13.9 | 113 | 30.7 | - | - | |||
5th semester | 125 | 15.4 | 125 | 34.0 | - | - | |||
Gender | n | % | n | % | n | % | |||
Female | 615 | 75.6 | 292 | 79.3 | 323 | 72.6 | |||
Male | 132 | 16.2 | 73 | 19.8 | 59 | 13.3 | |||
Mean | SD | Range | Mean | SD | Range | Mean | SD | Range | |
Age | 22.77 | 4.92 | 18-56 | 22.60 | 4.52 | 18-56 | 22.92 | 5.27 | 18-53 |
2.3. Rasch and graphical log-linear Rasch models
Based on previous studies of the psychometric properties of the HFR-S (Nielsen & Kreiner, 2018, 2021a), we did not expect all subscales of the HFS-R to fit pure Rasch models (RM; Rasch, 1960), and thus we used both the RM and graphical log-linear Rasch models (GLLRM; Kreiner & Christensen, 2007), which are both latent variable models. The RM is a measurement model, which, in statistical terms, is a parsimonious model (Fischer & Molenaar, 1995) describing the causal effect of a latent trait variable on responses to items (Borsboom, 2005), and it has particularly desirable properties (see section 2.3.1). GLLRMs are extended and generalized RMs, which retain most of the properties of the RM (Kreiner & Christensen, 2007). Both the RM and GLLRMs belong to the larger family of Item Response Theory (IRT) models, as the RM can be considered a special case of these and GLLRMs extend the RM, though not by adding parameters in the usual manner to extend to 2PL or 3PL models (Christensen, Kreiner & Mesbah, 2013; Fischer & Molenaar, 1995; van der Linden & Hambleton, 1997). Contrary to other psychometric IRT and CFA models, neither the RM nor the GLLRM need assumptions on the distribution of the latent variable (Kreiner & Christensen, 2007; Rasch, 1966; Wright & Panchapakesan, 1969).
2.3.1. The Rasch model
The RM is one among several latent variable models which can provide valid measurement of unobservable (i.e. latent) traits. We find the RM to be the preferable point of departure in analyses, because it is a parsimonious model and because it is the only IRT model that may provide specific objective measurement (Fischer & Molenaar, 1995; Rasch, 1961). This renders the RM unique because it is the only model where the raw score over all items is a sufficient statistic for the person parameter estimates (Fischer, 1995). Sufficiency is an attractive property for several reasons: one is that it allows assessment of fit and estimation of item parameters that do not depend on a specific distribution of the latent variable, another is that the sum score contains all the information needed to assess the level of the latent construct measured and can be used, if preferred, instead of the person parameter estimates.
The requirements for fit of a set of item responses to the RM are (Kreiner, 2013; Mesbah & Kreiner, 2013):
- Unidimensionality: The items of the scale must only assess one single underlying latent construct. In this case study: the TCA, IA, FAH and WS subscales assess four different constructs and separately they are unidimensional.
- Monotonicity: The expected item scores will increase with increasing values of the latent variable.
- Local independence of items (no local dependence; no LD): Responses to items should be conditionally independent from responses to any other item in the scale given the latent variable. In other words, local independence implies that responses to an item only depend on the level of the construct measured, and not on responses to other items.
- Invariance and no differential item functioning (no DIF): Items and exogenous variables (i.e., background variables) should be conditionally independent given the latent variable. Thus, responses to an item must only depend on the level of the construct measured. Gender or other subgroupings of students may have a direct effect on the construct being measured, but there should be no effect of the background variables on the responses to items given the latent variable. For single items and a background variable, this is termed absence of DIF, while for the entire set of items and a background variable, this is termed invariance.
- Homogeneity: the rank order of items by the expected item scores should be the same at all levels of the latent variable. In this case: the item requiring the least of the relevant construct to be endorsed (i.e., what we could term the easiest item or the item requiring the least anxiety to be endorsed) should be the same for students at a high level of the construct as for students at a lower level of the construct. In the same way, the ordering of all remaining items should be the same for all students no matter their level on the construct.
The first four requirements for fit to the RM meet Rosenbaum’s (1989) requirements for criterion-related construct validity, and thus we claim that RMs provide valid measurement. These requirements are common for all unidimensional IRT models. The fifth requirement of homogeneity is unique to the RM, and together with the first four requirements, this provides sufficiency of the sum score (i.e., the summed raw score is a sufficient statistic for the estimated person parameters, c.f. the above).
In this study, we used the Partial Credit model (PCM; Master, 1982) for ordinal categorical items, as this is a generalization of the RM for dichotomous items, and it provides the same measurement properties as the model for dichotomous items (Mesbah & Kreiner, 2013).
2.3.1. Graphical log-linear Rasch models
Measurement scales within the field of psychology are often challenged by DIF and/or local dependence (LD), as is evident also by the previous studies of the HFS-R (Nielsen & Kreiner, 2018, 2021a). To avoid eliminating items from already brief scales in order to obtain strict validity (c.f. the above requirements for the Rasch model), Kreiner and Christensen (2002, 2004, 2007) proposed a class of extended and generalized Rasch models referred to as graphical log-linear Rasch models (GLLRMs).
In GLLRMs, locally dependent items can be included as interaction terms, if the strength of the association between dependent items is constant across all levels of the latent variable. In the same way, interaction terms between items and background variables may be included in GLLRMS to account for DIF, if the direct effect of the background variable on the item is constant across all levels of the latent variable. DIF and LD satisfying these requirements are termed uniform DIF (Hanson, 1998), and likewise uniform LD. Kreiner (2007) and Kreiner and Christensen (2007) claimed that Rasch models with uniform DIF and uniform LD provide essentially valid and objective measurement (further information on essential validity is provided in supplemental file 2 in Nielsen & Kreiner, 2021a)[1].
In chain graph models, nodes representing variables and edges and arrows are used to illustrate associations among the variables. Missing edges or arrows between nodes mean that the variables are conditionally independent given the remaining variables in the model. A directed edge (arrow) connecting two variables may refer to a causal relationship, and undirected edges illustrate that the variables are conditionally dependent without causality assumed (see Lauritzen, 1996, for a comprehensive introduction to graphical models). In GLLRMs, items follow the same rules as other variables in graphical models. Thus, items which are not connected by an edge in a GLLRM graph are conditionally independent given the latent variable (i.e., items are locally independent). Likewise, items and exogenous variables that are not connected by an arrow are conditionally independent (i.e., they do not function differentially). Items are connected to the latent variable to indicate that the latent variable drives responses to the items. In addition, if background variables, which are considered criterion variables, are directly associated with the latent variable in the expected manner, this indicates that measurement is criterion valid.
2.3.2. Item analysis by Rasch models and GLLRMs
A rigorous test of the fit of a set of items in a single scale to a RM or a GLLRM includes the following steps:
- Overall test of homogeneity of item parameters across low and high-scoring groups.
- Overall tests of invariance relative to background variables.
- Fit of the individual items to the RM.
- Tests of no DIF for all items relative to background variables.
- Tests of local independence for all item pairs.
- Tests of unidimensionality if subject matter considerations suggest that more than one latent variable could lie behind the item responses.
The steps do not need to be taken in the order presented above. If evidence of LD or DIF turns up, log-linear interactions are added to the model and the above steps repeated until no further evidence against fit to the model is disclosed.
When the final model is known, the following steps conclude the analysis:
- Targeting and reliability relative to the current study population are evaluated.
- Tests of unidimensionality across the three anxiety subscales are conducted to confirm that these measure different latent traits.
All statistics used test whether item response data comply with the expectations of the model, and so for all results significant p-values signify evidence against the model. In line with the recommendations by Cox and colleagues (1977), we evaluated p-values as a continuous measure of evidence against the null hypothesis, distinguishing between weak (p < 0.05), moderate (p < 0.01), and strong (p < 0.001) evidence against the model. In addition, we used the Benjamini-Hochberg (1995) procedure to control the false discovery rate (FDR) due to multiple testing to reduce the amount of false evidence.
The fit of individual items to the RM (or subsequently a GLLRM) was tested by comparing the observed item-restscore correlations with the expected item-restscore correlations under the model (Christensen & Kreiner, 2013; Kreiner, 2011). Overall tests of homogeneity (i.e., are the item parameters the same for persons scoring high and low, respectively) and invariance (i.e., are the item parameters for the total set of items in a scale the same for persons belonging to subgroups) were conducted using Andersen’s conditional likelihood ratio test (CLR; Andersen, 1973). The local independence of items and absence of DIF was tested using Kelderman’s (1984) likelihood-ratio test, and if evidence against these assumptions were discovered, the magnitude of the local dependence of items and/or DIF was informed by partial Goodman-Kruskal gamma coefficients conditional on the restscores (Kreiner & Christensen, 2004). DIF-analyses and analyses of invariance were done in relation to six background variables: Sample (Danish, Swiss), Statistics course at university level (1st statistics course, not 1st statistics course), Perceived adequacy of mathematics level to learn statistics (more than adequate/adequate, less than adequate), Expectation to need statistics in future employment (yes, maybe, no), Gender (female, male), and Age group (20 years and younger, 21 years, 22 years and older).
If DIF was present, the sum scores were equated for DIF so that the direct effect of the background variable causing DIF would be taken into account, thus making the scale scores comparable across the relevant subgroups. To calculate such comparable scores, we first estimated the person parameters for the DIF subgroups based on the different sets of item parameters resulting from the DIF (also referred to as splitting for DIF; Hagquist et al., 2009). We then selected one subgroup as the reference and calculated the expected score for the remaining subgroups as if they had belonged to the reference group (i.e., that there was no DIF and the item parameters were identical for the subgroups) (Kreiner & Nielsen, 2023).
Reliability was calculated using Hamon and Mesbah’s (2002) Monte Carlo method, which takes into account any local dependence between items. Targeting[2] was assessed numerically with two indices (Kreiner & Christensen, 2013): the test information target index (the mean test information divided by the maximum test information) and the root mean squared error target index (the minimum standard error of measurement divided by the mean standard error of measurement). Both indices should have a value close to one. We also estimated the target of the observed score and the standard error of measurement of the observed score. Lastly, to provide a graphical illustration of targeting and test information, we plotted person-item maps showing the distribution of the person parameter estimates against the item category thresholds, with the inclusion of the test information curve.
Unidimensionality across the three anxiety subscales (TCA, IA & FAH) was tested by pairwise comparisons of the observed and expected gamma (γ) correlations under the model (Horton et al, 2013). Scales measuring different constructs will be less strongly correlated than what is expected under the common unidimensional model.
2.4 Software
All item analyses were conducted with the DIGRAM software package (Kreiner, 2003; Kreiner & Nielsen, 2013, 2023), while the item maps were generated using R.
3. Results
We report the main results for the four subscales in this section, while some additional results are provided in the supplemental file. All items are referred to by their original item number in Nielsen and Kreiner (2018), in order to make comparisons to other studies straightforward.
After exclusion of item TCA8 (Going through an exam assignment in statistics after the grade has been given)[3], item IA8 (Seeing a fellow student concentrating on their output from statistical analyses)[4] and item WS8 (Statistics provides the most objective and firm knowledge)[5], the reduced TCA (6 items), IA (7 items) and WS (5-items) subscales each fitted a graphical log-linear Rasch model (GLLRM) with DIF as well as locally dependent items (Figure 1). The full 5-item FAH subscale also fitted a GLLRM with DIF and locally dependent items (Figure 1). When taking into account the DIF and local dependence within each subscale, there was no evidence against overall homogeneity (i.e. no difference in item parameters across low and high-scorers) or against overall invariance or any additional DIF across subgroups defined by Sample, Course number, Perceived adequacy of mathematics level to learn statistics, Expectancy to need statistics in future employment, Gender or Age groups (Table 2), nor was there any evidence against the fit of individual items (Table A4 in the Appendix).
The GLLRMs for all subscales included some locally dependent items (see section 3.1. for details) and DIF relative to sample for up to four items. The FAH and IA subscale GLLRMs additionally included DIF relative to Course number, while the WS subscale GLLRM included DIF relative to Perceived adequacy of mathematics level to learn statistics (Figure 1, see section 3.2 for further details). Results of the CLR tests confirming that the DIF and local dependence interaction terms should be included in the respective models are provided in Table A4, and item category thresholds, difficulties, and targets are provided in Table A5 in the Appendix.
The results of equating sum scores for DIF are shown in Tables A6 to A9 in the Appendix, while the assessment of the effect of DIF is shown in section 3.2 (Tables 3 to 6).
3.1 Local dependence
The analyses revealed evidence against conditional independence of some items in all four subscales of the HFS-R (Figure 1 & Table A4). In the TCA subscale, five items were found to be locally dependent with moderate (items TCA2 and TCA7), strong (TCA2 and TCA4), and very strong (TCA1 and TCA3) partial g correlations (Figure 1, top left). The first locally dependent pair of items was TCA2 (Doing the homework for a statistics course) and TCA7 (Attending lectures in statistics), the second pair was TCA2 (c.f. above) and TCA4 (participating in statistics exercises), and the third pair was TCA1 (Studying for an examination in a statistics course) and TCA3 (Doing the final examination in a statistics course).
In the FAH subscale, three items were pairwise locally dependent with moderate (FAH2 and FAH3) to strong partial g correlations (FAH1 and FAH2, FAH1 and FAH3, respectively) (Figure 1, top right). The locally dependent item pairs were: FAH2 (Asking for help with statistical analyses in class) and FAH3 (Asking one of your tutors for help in understanding a printout), FAH1 (Going to ask my statistics teacher for individual help with material I am having difficulty understanding) and FAH2, and FAH1 and FAH3.
In the IA subscale, two pairs of items were locally dependent to a moderate (IA2 and IA5) or strong (IA5 and IA6) degree (Figure 1, bottom left). The locally dependent items were IA2 (Making a decision based on statistical analyses) and IA5 (Trying to understand the output from statistical analyses), and IA5 and IA6 (Interpreting the meaning of a probability value once I have found it).
Finally, in the WS subscale, a single pair of items showed local dependence to a moderate degree (Figure 1, bottom right): WS5 (Statistics is useful) and WS7 (Statistics is an indispensable part of my academic program).
3.2. Effect of differential item functioning
Evidence of differential item functioning was found for all four subscales of the HFS-R, however, in relation to different background variables and of differing strength (Figure 1 and Table A4 in the Appendix) and differing impact on subsequent group comparisons (Table 3 to 6). Sample DIF (Danish versus Swiss) was found in all four subscales, DIF relative to course number (first statistics course versus not first statistics course) was also found in the FAH and IA subscales, while DIF relative to Perceived adequacy of mathematics level to learn statistics (more than adequate/adequate versus less than adequate) was found in the WS subscale.
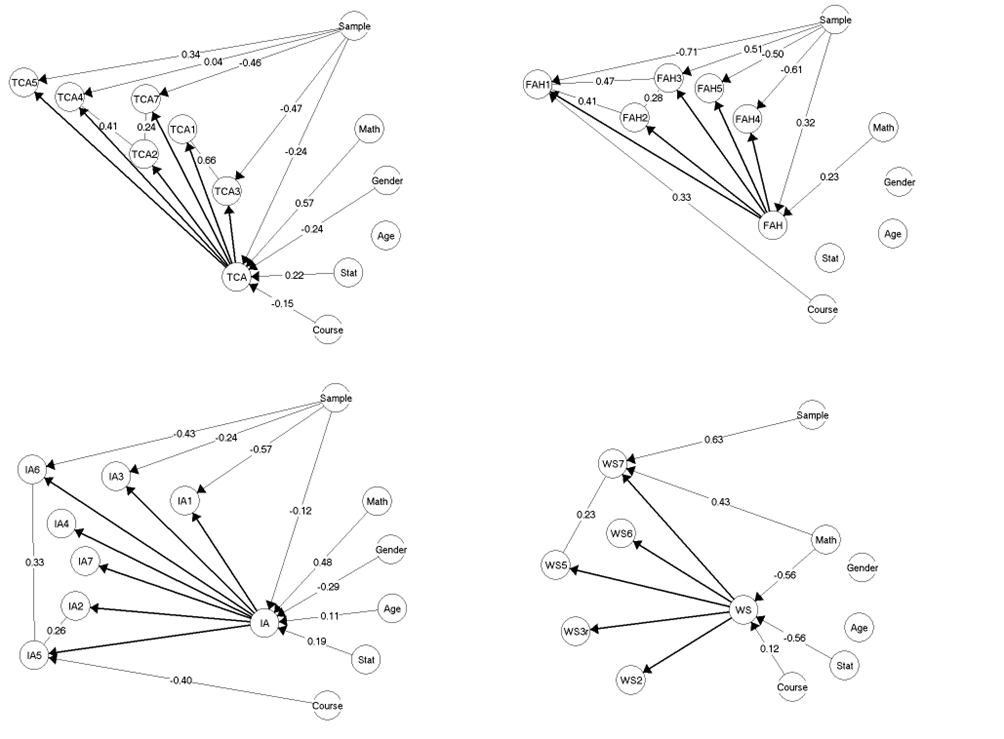
Figure 1.
The Final Models for the Four HFS-R Subscales. Test and Class Anxiety (Top Left), Fear of Asking for Help (Top Right), Interpretation Anxiety (Bottom Left), Worth of Statistics (Bottom Right).
Table 2.
Global Tests of Homogeneity and Invariance for the Final HFS-R Graphical Loglinear Subscale Models in Figure 1
Tests of fit | TCAa | FAHb | IAc | WSd | ||||||||
CLR | df | p | CLR | df | p | CLR | df | p | CLR | df | p | |
Global homogeneitye | 49.3 | 52 | .579 | 52.5 | 47 | .269 | 51.4 | 52 | .497 | 21.6 | 26 | .708 |
Invariance | ||||||||||||
Sample | 43.3 | 28 | .032+ | 44.4 | 29 | .034+ | 44.0 | 29 | .036+ | 25.6 | 20 | .178 |
Course number | 75.0 | 52 | .020+ | 63.9 | 41 | .012+ | 69.3 | 46 | .015+ | 25.8 | 26 | .477 |
Math adequacy | 79.3 | 52 | .009+ | 36.0 | 47 | .878 | 42.4 | 52 | .827 | 17.8 | 20 | .602 |
Stat future employment | 106.0 | 104 | .426 | 86.6 | 94 | .034+ | 104.6 | 104 | .466 | 65.6 | 52 | .098 |
Gender | 48.7 | 52 | .605 | 55.6 | 47 | .182 | 36.2 | 52 | .953 | 35.3 | 26 | .105 |
Age group | 55.7 | 52 | .339 | 64.8 | 47 | .043+ | 76.6 | 52 | .015+ | 34.8 | 26 | .116 |
3.2.1 The Test and Class Anxiety subscale
Four items of the TCA subscale functioned differentially relative to Sample (Figure 1 and Table A4 in the Appendix); TCA3 (Doing the final examination in a statistics course) and TCA7 (Attending lectures in statistics) with the Danish students more likely to report high levels of anxiety in relation to these activities, no matter their level of TCA. Swiss students were more likely to report high levels of anxiety withTCA4 (Participating in statistics exercises) and TCA5 (Finding that another student in class got a different answer than you did to a statistical problem), regardless of their level of TCA. No DIF was discovered for any of the other included background variables.
The overall effect of the sample DIF on the TCA sum score is shown in Table 3, which also shows the test bias that would result if the sum scores were not equated for DIF. The largest bias of approximately one third of a point was observed for the group of students perceiving their mathematics level to be less than adequate to learn statistics. The conclusions from the subgroup comparisons were the same whether the observed sum scores or the DIF-equated sum scores were used in the comparisons, and thus the effect of the DIF was not large enough to lead to statistical errors in this sense, though the difference in the mean scores of the Danish and Swiss sample was slightly reduced.
Table 3.
Comparison of Observed and DIF-equated Mean TCA Sum Scores for Subgroups of Students
Subgroups of students (n) | observed scores | equated scores | bias | ||
Mean | SE | Mean | SE | ||
Subsamples (DIF source) | |||||
Danish (355) | 12.29 | 0.16 | 12.29 | 0.16 | 0.00 |
Swiss (334) | 11.10 | 0.16 | 11.31 | 0.19 | -0.20 |
p | < .001 | < .001 | |||
Statistics course at university level | |||||
1st stat course (357) | 12.05 | 0.16 | 12.13 | 0.17 | -0.08 |
Not 1st stat course (332) | 11.36 | 0.16 | 11.47 | 0.18 | -0.11 |
p | .002 | .008 | |||
Perceived adequacy of mathematics level to learn statistics | |||||
More than adequate/adequate (597) | 11.29 | 0.11 | 11.35 | 0.12 | -0.06 |
Not quite adequate/entirely inadequate (92) | 14.48 | 0.31 | 14.84 | 0.33 | -0.37 |
p | < .001 | < .001 | |||
Expectancy to need statistics in future employment | |||||
Yes (251) | 10.83 | 0.16 | 10.89 | 0.19 | -0.06 |
Maybe (352) | 11.90 | 0.16 | 12.01 | 0.18 | -0.12 |
No (86) | 13.56 | 0.31 | 13.70 | 0.33 | -0.14 |
p | < .001a | < .001a | |||
Gender | |||||
Female (566) | 11.96 | 0.12 | 12.08 | 0.13 | -0.12 |
Male (123) | 10.59 | 0.27 | 10.61 | 0.30 | -0.02 |
p | < .001 | < .001 | |||
Age groups | |||||
21 years and younger (387) | 11.51 | 0.14 | 11.61 | 0.15 | -0.10 |
22 years and older (302) | 11.98 | 0.19 | 12.08 | 0.21 | -0.10 |
p | .047 | .070 | |||
3.2.2 The Fear of Asking for Help subscale
Four items in the FAH subscale functioned differentially relative to Sample (Figure 1 and Table A4 in the Appendix); FAH1 (Going to ask my statistics teacher for individual help with material I am having difficulty understanding), FAH3 (Asking one of your tutors for help in understanding a printout), FAH4 (Asking for an explanation of something I do not understand in statistics lectures), and FAH5 (Asking a fellow student for help in understanding output). For FAH1 and FAH 4, the DIF was such that the Danish students were more likely to report high levels of fear of asking for help, regardless of their level of FAH, while the Swiss students were more likely to endorse items FAH3 and FAH5. In addition, item FAH1 also functioned differentially relative to course number (i.e. whether students were taking their first statistics course or not). No DIF was discovered for the remaining background variables.
Table 4 shows that substantial test bias would resul,t if the sum scores were not equated for the discovered DIF for almost all subgroups (more than half a point on the scale), and this is more severe when comparing the Swiss students to the Danish students (-1.20 points on the scale). Thus, while the overall conclusions of group comparisons were the same whether the observed sum scores or the DIF-equated sum scores were used, the substantial bias resulting from a failure to DIF-equate the FAH scores would provide results that would be substantially off-mark in subgroup comparisons. Again, as for the TCA subscale, differences in mean scores are reduced in size as a result of the DIF-equating, and in the case of perception of mathematics level, the evidence of a difference in FAH scores for the two groups was weakened when DIF-equating was performed (i.e., p value changed om 0.010 to 0.028).
Table 4.
Comparison of Observed and DIF-equated mean FAH Sum Scores for Subgroups of Students
Subgroups of students (n) | observed scores | DIF-equated scores | bias | ||
Mean | SE | Mean | SE | ||
Subsamples (DIF source) | |||||
Danish (357) | 7.82 | 0.15 | 7.73 | 0.14 | 0.09 |
Swiss (334) | 9.40 | 0.19 | 10.60 | 0.22 | -1.20 |
p | < .001 | < .001 | |||
Statistics course at university level (DIF source) | |||||
1st stat course (357) | 8.63 | 0.17 | 9.18 | 0.19 | -0.55 |
Not 1st stat course (332) | 8.53 | 0.17 | 9.05 | 0.20 | -0.52 |
p | .660 | .630 | |||
Perceived adequacy of mathematics level to learn statistics | |||||
More than adequate/adequate (598) | 8.45 | 0.13 | 8.99 | 0.15 | -0.54 |
Not quite adequate/entirely inadequate (93) | 9.42 | 0.35 | 9.93 | 0.40 | -0.51 |
p | .010 | .028 | |||
Expectancy to need statistics in future employment | |||||
Yes (251) | 8.55 | 0.21 | 9.28 | 0.25 | -0.73 |
Maybe (352) | 8.52 | 0.16 | 8.99 | 0.19 | -0.47 |
No (86) | 8.97 | 0.34 | 9.20 | 0.36 | -0.24 |
p | .484a | .618a | |||
Gender | |||||
Female (569) | 8.62 | 0.13 | 9.15 | 0.15 | -0.52 |
Male (122) | 8.39 | 0.28 | 8.99 | 0.33 | -0.60 |
p | .463 | .673 | |||
Age groups | |||||
21 years and younger (387) | 8.40 | 0.16 | 8.00 | 0.19 | -0.60 |
22 years and older (304) | 8.82 | 0.19 | 8.27 | 0.21 | -0.45 |
p | .091 | .345 | |||
3.2.3 The Interpretation Anxiety subscale
As for the FAH subscale, there were items that functioned differentially relative to Sample and course number in the IA subscale (Figure 1 and Table A4 in the Appendix). No DIF was discovered for the remaining background variables. Three items function differentially relative to Sample: IA1 (Interpreting the meaning of a table in a journal article), IA3 (Interpreting the meaning of a probability value once I have found it), and IA6 (Interpreting the meaning of a probability value once I have found it), with the Danish students being more likely to report higher levels of anxiety in relation to these activities, no matter their level of IA. In addition, IA5 (Trying to understand the output from statistical analyses) functioned differentially relative to course number (i.e. whether student were taking their first statistics course or not): so that students taking their first statistics course were more likely to report high anxiety, no matter their level of IA.
Table 5 shows that, again, substantial test bias would result, if the sum scores were not equated for the discovered DIF for almost all subgroups (more than half a point on the scale in most cases), and the most severe for the Swiss students compared to the Danish students (-0.95 points on the scale). Further, in this case, a Type I error would ensue if DIF equating was not performed, as we would falsely claim that there was a difference in the Danish and Swiss students’ levels of Interpretation Anxiety, when this was not the case if DIF was accounted for. For the remaining variables defining subgroups, the overall conclusion of comparisons would not differ across the observed and the DIF-equated scores. However, the evidence of a difference in Interpretation Anxiety between the younger and the older group of students is strong when scores have been equated for DIF, while only weak if the DIF had not been taken into account.
Table 5.
Comparison of Observed and DIF-equated Mean IA Sum Scores for Subgroups of Students
Subgroups of students (n) | observed scores | DIF-equated scores | bias | ||
Mean | SE | Mean | SE | ||
Samples (DIF source) | |||||
Danish (354) | 15.74 | 0.20 | 15.83 | 0.20 | -0.09 |
Swiss (341) | 14.72 | 0.17 | 15.68 | 0.19 | -0.95 |
p | < .001 | .581 | |||
Statistics course at university level (DIF source) | |||||
1st stat course (356) | 15.45 | 0.20 | 15.75 | 0.20 | -0.30 |
Not 1st stat course (339) | 15.02 | 0.18 | 15.76 | 0.19 | -0.74 |
p | .104 | .969 | |||
Perceived adequacy of mathematics level to learn statistics | |||||
More than adequate/adequate (602) | 14.77 | 0.13 | 15.27 | 0.14 | -0.50 |
Not quite adequate/entirely inadequate (93) | 18.29 | 0.37 | 18.87 | 0.38 | -0.58 |
p | < .001 | < .001 | |||
Expectancy to need statistics in future employment | |||||
Yes (256) | 14.30 | 0.19 | 14.91 | 0.20 | -0.61 |
Maybe (354) | 15.39 | 0.19 | 15.86 | 0.19 | -0.47 |
No (85) | 17.45 | 0.41 | 17.84 | 0.41 | -0.40 |
p | < .001a | < .001a | |||
Gender | |||||
Female (572) | 15.55 | 0.15 | 16.07 | 0.15 | -0.52 |
Male (123) | 13.80 | 0.29 | 14.31 | 0.31 | -0.50 |
p | < .001 | < .001 | |||
Age groups | |||||
21 years and younger (388) | 14.95 | 0.17 | 15.42 | 0.17 | -0.47 |
22 years and older (307) | 15.61 | 0.21 | 16.17 | 0.22 | -0.57 |
p | .016 | .007 | |||
3.2.4 The Worth of Statistics subscale
In the WS subscale, evidence of DIF was found for item WS7 (Statistics is an indispensable part of my academic program) both in relation to Sample and whether students perceived their mathematics level as adequate or not for learning statistics (Figure 1 and Table A4 in the Appendix). The Swiss students and students who perceived their mathematics level as less than adequate for learning statistics being more likely to agree with the items, no matter their level on the WS scale. No DIF was discovered for the remaining background variables.
Table 6 shows that some test bias would result if the sum scores were not equated for the discovered DIF for almost all subgroups (up to half point on the scale), with the most severe bias being for the group of students perceiving their level of mathematics to be less than adequate for learning statistics (0.54), and the Swiss students (0.44). The overall conclusions of group comparisons were the same whether the observed or the DIF-equated sum scores were used. Differences in mean scores were reduced in size as a result of the DIF-equating, and in the case of previous courses in statistics, the evidence of a difference in WS scores between students in their first or a later statistics course disappeared.
Table 6.
Comparison of Observed and DIF-equated Mean WS Sum Scores for Subgroups of Students
Subgroups of students (n) | observed scores | DIF-equated scores | bias | ||
Mean | SE | Mean | SE | ||
Samples (DIF source) | |||||
Danish (351) | 14.45 | 0.14 | 14.40 | 0.15 | 0.05 |
Swiss (333) | 15.47 | 0.14 | 15.03 | 0.15 | 0.44 |
p | < .001 | .003 | |||
Statistics course at university level | |||||
1st stat course (351) | 14.74 | 0.15 | 14.54 | 0.15 | 0.20 |
Not 1st stat course (333) | 15.17 | 0.15 | 14.88 | 0.15 | 0.29 |
p | .037 | .112 | |||
Perceived adequacy of mathematics level to learn statistics (DIF source) | |||||
More than adequate/adequate (592) | 15.29 | 0.11 | 15.09 | 0.11 | 0.10 |
Not quite adequate/entirely inadequate (92) | 12.75 | 0.26 | 12.21 | 0.26 | 0.54 |
p | < .001 | < .001 | |||
Expectancy to need statistics in future employment | |||||
Yes (253) | 16.55 | 0.13 | 16.30 | 0.14 | 0.25 |
Maybe (348) | 14.52 | 0.13 | 14.28 | 0.13 | 0.24 |
No (83) | 11.84 | 0.27 | 11.61 | 0.27 | 0.23 |
p | < .001a | < .001a | |||
Gender | |||||
Female (563) | 14.81 | 0.11 | 14.57 | 0.12 | 0.24 |
Male (121) | 15.58 | 0.23 | 15.34 | 0.24 | 0.24 |
p | .003 | .004 | |||
Age groups | |||||
21 years and younger (383) | 14.81 | 0.13 | 14.57 | 0.14 | 0.24 |
22 years and older (301) | 15.13 | 0.16 | 14.88 | 0.17 | 0.25 |
p | .129 | .149 | |||
3.3 Targeting and reliability
Table 7 summarizes the results of the analysis of targeting and reliability. Targeting was more than adequate for most subgroups in the four HFS-R subscales with a few exceptions: The targeting of the TCA subscale was, however, poor for the Swiss sample of psychology students, with only 40% of the maximum test information obtained. Likewise, the targeting of the FAH subscale was less than adequate (just below 60% information obtained) for the Danish sample no matter if they were taking their first or a subsequent statistics course. The targeting of the IA and WS subscales were quite similar for the Danish and Swiss samples in terms of the information achieved. When comparing the target values with the mean scores (theta or the sum scores), as an expression of targeting, there were differences between the sample subgroups, particularly for the IA and the FAH subscale, where these values are closer together for the Danish students compared to the Swiss students (Table 7). Such differences and similarities in targeting arise naturally as a result of the combination of differences in levels on the measures and differences in item difficulty due to i.e. DIF, and are thus not surprising.
The item maps (Figures A1 to A4 in the Appendix) illustrate both the level of information along the scales, the point of maximum information (the target), and the degree of alignment of the person estimates and the item thresholds. Figure A1 shows that students in the Danish sample are located evenly across the range with item thresholdsalong the TCA scale and that information is relatively high along the scale. However, many students in the Swiss sample are located where there is no item information, thus the information is quite low along the majority of the scale. The poorer targeting of the FAH for the Danish students compared to the Swiss students is illustrated by the poorer alignment between items and persons along the scale, as the items have the most information at the higher end and the Danish students are located more toward the lower end of the scale in comparison to the Swiss students (Figure A2).
The reliability of the four subscales of the HFS-R was satisfactory for research and statistical purposes for all subgroups except two: the TCA for the sample of Danish psychology students (r = 0.62) and the WS subscale for the group of Danish students, who found their level of mathematics inadequate for learning statistics (r = 0.46). The item maps for the TCA and the WS subscales (Figures A1 and A4 in the Appendix), illustrate the reason for the low reliabilities for the Danish students, as there is substantially less variation in the person estimates than for the Swiss students and particularly so on the WS subscale for the Danish students who perceived their mathematics level to learn statistics to be inadequate.
Table 7.
Targeting and Reliability of the Test and Class Anxiety, Fear of Asking for Help, Interpretation Anxiety and Worth of Statistics Subscales
Theta | Sum score | |||||||||||
Groups defined by DIF (n)a | target | mean | TI mean | TI max | TI Target index | RMSE mean | RMSE min | RMSE target index | target | mean | mean SEM | rb |
Test and Class Anxiety | ||||||||||||
Danish (355) | 1.15 | -0.80 | 3.150 | 4.183 | 0.753 | 0.569 | 0.489 | 0.860 | 19.40 | 12.39 | 1.77 | 0.62 |
Swiss (334) | 1.39 | -1.20 | 2.234 | 5.592 | 0.400 | 0.696 | 0.423 | 0.608 | 19.55 | 11.10 | 1.47 | 0.74 |
Fear of Asking for Help | ||||||||||||
Danish, 1st stat course (225) | -0.71 | -1.94 | 2.077 | 3.515 | 0.591 | 0.664 | 0.533 | 0.803 | 10.88 | 7.84 | 1.38 | 0.74 |
Swiss, 1st stat course (132) | 1.09 | -0.55 | 2.398 | 3.127 | 0.767 | 0.643 | 0.566 | 0.879 | 14.40 | 9.99 | 1.52 | 0.79 |
Danish, not 1st stat course (131) | -1.06 | -2.11 | 2.077 | 3.596 | 0.577 | 0.658 | 0.527 | 0.801 | 10.20 | 7.77 | 1.37 | 0.73 |
Swiss, not 1st stat course (203) | 0.87 | -1.11 | 2.156 | 3.079 | 0.700 | 0.671 | 0.570 | 0.849 | 14.15 | 9.02 | 1.42 | 0.81 |
Interpretation Anxiety | ||||||||||||
Danish, 1st stat course (224) | 0.32 | -0.48 | 2.725 | 3.171 | 0.859 | 0.615 | 0.562 | 0.914 | 18.05 | 15.80 | 1.64 | 0.81 |
Swiss, 1st stat course (130) | 1.82 | -0.56 | 2.447 | 3.106 | 0.788 | 0.648 | 0.567 | 0.876 | 21.35 | 14.86 | 1.56 | 0.79 |
Danish, not 1st stat course (132) | 0.85 | -0.47 | 2.718 | 3.299 | 0.824 | 0.615 | 0.551 | 0.895 | 19.40 | 15.63 | 1.64 | 0.79 |
Swiss, not 1st stat course (209) | 1.70 | -0.52 | 2.415 | 3.293 | 0.733 | 0.652 | 0.551 | 0.845 | 20.78 | 14.64 | 1.55 | 0.75 |
Worth of Statistics | ||||||||||||
Danish, Math adequate (298) | -0.85 | 1.12 | 1.763 | 2.237 | 0.788 | 0.761 | 0.669 | 0.879 | 10.96 | 14.81 | 1.32 | 0.74 |
Swiss, Math adequate (194) | -0.67 | 1.45 | 1.594 | 2.163 | 0.737 | 0.805 | 0.680 | 0.845 | 11.88 | 15.78 | 1.25 | 0.74 |
Danish, Math not adequate (53) | -1.40 | -0.34 | 2.164 | 2.498 | 0.866 | 0.682 | 0.633 | 0.928 | 10.00 | 12.43 | 1.47 | 0.46 |
Swiss, Math not adequate (39) | -2.27 | -0.20 | 1.914 | 2.272 | 0.843 | 0.731 | 0.663 | 0.908 | 8.86 | 13.18 | 1.38 | 0.78 |
3.4 Unidimensionality of the anxiety subscales
Results of the pairwise tests of the hypothesis of unidimensionality across the three anxiety subscales comparing the observed and expected correlations between subscale scores rejected unidimensionality, as the observed correlations were significantly and substantially weaker than the expected correlation under a unidimensional model in all three cases (Table 8).
Table 8.
Tests of Unidimensionality of the Three Anxiety Subscales
Anxiety Subscales | observed g | expected g | se expected g | asymptotic p | exact p* |
TCA & IA | .477 | .548 | .022 | <.01 | < .001 |
TCA & FAH | .267 | .408 | .027 | <.001 | < .001 |
IA & FAH | .218 | .440 | .026 | <.001 | <. 001 |
4. Discussion
4.1. Number of items in subscales
A total of three items from the HFS-R were eliminated during the items analyses in order to secure fit to graphical log-linear Rasch models for the respective subscales. The items were IA8, WS8 and TCA8. Items WS8 and IA8 (Seeing a fellow student concentrating on their output from statistical analyses) were also eliminated during analyses by Nielsen and Kreiner (2021a) for a sample of psychology students. Teman (2013) also eliminated item 18, “Watching a student search through a load of computer printouts from his/ her research” from the original STARS TCA subscale due to lack of item fit – the original version of IA8 prior to adaptation by Nielsen and Kreiner (2018). Comparison of the IA8 response distributions for the Swiss and Danish students showed no evidence of a difference between the Danish and the Swiss students (Table A11 in the Appendix).
The response distributions for Item WS8 (Statistics provides the most objective and firm knowledge) showed strong evidence of a difference between the Danish and Swiss students, in the sense that the Swiss student were more inclined to agree with the statement than the Danish students (Table A12 in the Appendix). This was more than likely due to the particularly strong focus on empirical research methods and statistics in the early semesters of the curriculum at the participating Swiss university.
Item TCA8 (going through an exam assignment in statistics after the grade has been given) more than likely did not fit the model due to differences in the interpretation of this items stemming from the differences in how actively students seek information on individual assignments after grading. In Denmark, it is not uncommon for psychology students to get and utilize an opportunity to receive either individual or general feedback on assignments after grading, while in the participating Swiss university, students receive detailed feedback only if they formally ask for this information. When comparing the TCA8 response distribution for Danish and Swiss students, the Swiss students report less anxiety in this regard, which may be due to their lack of familiarity with going through exam assignments after grading (Table A10 in the Appendix). As the TCA8 item is not included in the STARS (Cruise & Wilkins, 1980), comparisons to additional research was not possible.
4.2. Differential item functioning relative to sample
The findings on differential item functioning relative to the two samples will only be discussed in relation to the different educational settings/cultures in the Danish and Swiss psychology programs included in the study, as no previous research has compared language versions in such different settings.
In the Test and Class Anxiety subscale four items functioned differentially relative to Sample. For items TCA3 (Doing the final examination in a statistics course) and TCA7 (Attending lectures in statistics) the DIF was such that the Danish psychology students were systematically more likely to report high levels of anxiety. For items TCA4 (Participating in statistics exercises) and TCA5 (Finding that another student in class got a different answer than you did to a statistical problem), it was the Swiss psychology students who were systematically more likely to report high levels of anxiety. Differences in the settings (type of exams, organizational aspects of the lectures, how exercise sessions were organized, class sizes, and – as a result – to what degree students would even notice if another student had a different answer or not) may be responsible for these DIF effects.
In the FAH subscale four items functioned differentially relative to Sample. FAH1 (Going to ask my statistics teacher for individual help with material I am having difficulty understanding) and FAH4 (Asking for an explanation of something I do not understand in statistics lectures) functioned differentially so that the Danish psychology students were systematically more likely to report high levels of anxiety for these, regardless of their level of Fear of Asking for Help. For FAH3 (Asking one of your tutors for help in understanding a printout) and FAH5 (Asking a fellow student for help in understanding output), the opposite was the case, so that the Swiss psychology students were systematically more likely to report high levels of anxiety. Again, these differences may be due to differences in the settings (such as differences in how the lectures and exercise sessions are organized, how much contact the students had to the lecturers and tutors, class size and its effect on how much the students interacted with each other).
Three items functioned differentially in the Interpretation Anxiety subscale relative to Sample. The DIF for all three items: IA1 (Interpreting the meaning of a table in a journal article), IA3 (Reading a journal article that includes some statistical analyses), and IA6 (Interpreting the meaning of a probability value once I have found it) was such that the Danish psychology students were systematically more likely to report high levels of anxiety for these situations, regardless of their level of Interpretation Anxiety. One possible reason for this may be actual differences in the Danish and the Swiss students’ perceptions of the interpreting of statistical results by themselves as ”threatening”, but also that the Swiss students tend to be less exposed to interpretation tasks in their curriculum during the first semesters.
In the WS subscale, evidence of sample DIF was only found for item WS7 (Statistics is an indispensable part of my academic program), so that the Swiss students were systematically more likely to agree to the statement than were the Danish students, regardless of their level on the Worth of Statistics scale. The higher agreement of the Swiss students may reflect the fact that in the curriculum for the Swiss students, passing the introductory statistics module is a formal requirement for proceeding with the psychology studies, making it appear more high stakes for the Swiss students. The Danish students would be able to proceed with their studies, though they would have to retake the statistics course at some point to achieve the degree.
In summary, besides possible effects of the different language versions, there were differences in the mode of administration of the surveys and in the organization of the statistics courses in the two countries that may be responsible for the DIF, as well as what could be systematic differences in the perception of certain activities as threatening (e.g. interpretation of results). What is worth noticing though, is that the effects of DIF in some cases are so large in terms of test bias that failing to equate the sum scores would lead to a type I error, when making comparisons across subgroups – the same would be the case for the person parameter estimates. For example, a lack of DIF-equating of the Interpretation Anxiety score would have led us to falsely claim a significant difference between the Danish and the Swiss students, when, in fact, there was none. With the Fear of Asking for Help subscale, the test bias was even bigger than for the Interpretation Anxiety subscale. However, in this case the conclusion of a comparison of the Danish and the Swiss students would be the same whether DIF-equating was performed or not, as the differences between the sample groups were very large already.
4.3. Targeting and reliability
The targeting of the Interpretation Anxiety and Worth of Statistics subscales was very good, as 73-87% of the maximum information was obtained for subgroups, and there was not much variation between the Danish and the Swiss samples (Table 7), except for the location of the test target in relation to the mean scores. Figures A3 and A4 (in Appendix) also illustrate the good alignment of item thresholds and person estimates, as well as the high level of information along the scales for each subgroup and the differences in where the target is located for the Danish and Swiss students. For the Fear of Asking for Help subscale, there were no big differences either, but the obtained information was lower; from 59-77% for subgroups, and lowest for the Danish students. Figure A3 (in Appendix) illustrates the higher level of information along the scale for the Swiss students compared to the Danish, as well as the slightly poorer alignment of item thresholds to person estimates for the Danish students. Finally, targeting of the Test and Class Anxiety subscale was markedly poorer for the Swiss students, with only 40% of maximum information obtained and a poorer alignment of item thresholds to person estimates, as compared to the Danish students (Table 7 and Figure A1 in Appendix).
The reliability of the four subscales varied across the subgroups for which items functioned differentially, and thus across the Danish and the Swiss samples of psychology students. Important differences in reliability and reliabilities below the standard 0.70 benchmark for scales intended for statistical analyses were only found in two of the subscales. The reliability of the Test and Class Anxiety scale was highest for the Swiss students (0.74 versus 0.62). This and the too low reliability are likely the result of less variation in the Danish sample in regard to Test and Class Anxiety (see also Figure A1 in the Appendix). The largest difference in reliability between Danish and Swiss students was found for the Worth of Statistics subscale; For Danish students perceiving their mathematics level to be inadequate for learning statistics, the reliability was only 0.46, while it was 0.78 for their Swiss counterparts. The very low reliability for the Danish students perceiving their mathematics level as inadequate is likely due to the lack of variation in their responses to the WS items (see in Figure A4). For students perceiving their mathematics level as adequate, there was no difference in the reliability for the Swiss and Danish students. With the exception of the very low reliability of the WS subscale for Danish students perceiving their mathematics level as inadequate for learning statistics, the reliabilities for the current samples are comparable to or higher than reliabilities reported for other Danish samples of sociology, public health, and psychology students. (Nielsen & Kreiner, 2018; 2021a).
4.4. Dimensionality
Unidimensionality across the three anxiety subscales was rejected. This is in correspondance with the previous Danish studies of the measurement properties of the HFS-R (Nielsen & Kreiner, 2018, 2021a). Other research using the 1980-version of the STARS (Cruise & Wilkins, 1980), have found support for the original sub-scale structure and is thus also in agreement with the present findings (DeVaney, 2016). However, another research group, also using the STARS, have proposed that the three anxiety subscales could (and should) be combined into a single scale, thus disagreeing with the current study regarding dimensionality (Macher, et al., 2011; Macher et al., 2013; Papousek et al., 2012).
- Conclusions
In conclusion, Danish and Swiss psychology students differed in their levels of Test and Class Anxiety, Fear of Asking for Help, and Worth of Statistics, while they did not differ in their levels of Interpretation Anxiety. The measurement properties of the German and Danish versions of the HFS-R also differed substantially. While some of the psychometric differences could be adjusted for statistically, comparisons of statistical anxiety and attitudes towards statistics across higher education in different countries are, at best, a difficult task, even when all students are in the same academic discipline (i.e., psychology) and multiple language versions of an instrument are available. This we have shown with the HFS-R, but we believe that the findings extend to other instruments, as the measurement issues can, to some degree, be attributed to differences in the settings students encounter in their respective (psychology) programs as well as differences in higher education cultures in general. Thus, cross-cultural studies of statistical anxiety and attitudes towards statistics should be approached with caution, as comparisons are, at best, difficult to interpret and understand.
Author contributions
Conceptualization: Tine Nielsen, Carolina Fellinghauer.
Translation: Carolina Fellinghauer, Carolin Strobl, Tine Nielsen.
Data curation: Tine Nielsen, Carolina Fellinghauer, David Kronthaler.
Formal analysis: Tine Nielsen.
Investigation: Tine Nielsen, Carolina Fellinghauer, David Kronthaler.
Methodology: Tine Nielsen, Svend Kreiner.
Project administration: Tine Nielsen, Carolina Fellinghauer.
Software: Svend Kreiner, Tine Nielsen.
Validation: Tine Nielsen.
Writing – original draft: Tine Nielsen, Carolina Fellinghauer, Carolin Strobl.
Writing – review & editing: Tine Nielsen, Carolina Fellinghauer, Carolin Strobl, David Kronthaler, Svend Kreiner.
Acknowledgements
We would like to thank Dr Maren Böcker for her contribution to the translation of the HFS-R to German. We also thank Pedro Ribeiro Santiago for providing the R code used to produce the item maps shown in Tables A1 to A4 in the Appendix.
Funding
The author(s) received no specific funding for this work from any funding agencies.
Conflict of Interest
The authors declare no conflict of interest.
Data Availability Statements
The data set used is publicly available at: https://doi.org/10.5281/zenodo.14288514
Manuscript Received: 11 DEC 2024
Final Version Received: 14 MAR 2025
Published Online Date: 22 MAR 2025
Appendix - Further results
The appendix contains first a table with distribution of items responses, then three tables with additional information on the analysis of items by graphical loglinear Rasch models (GLLRM), and finally four figures containing the item maps for each scale to illustrate the targeting of the scales for the various subgroups functioning differentially. Table A1 shows the German translations of items as well as the original Danish items, including those eliminated from the final models. Table A2 shows response distributions on all items, including those eliminated from the final models.
Table A1.
The Danish and German versions of the Statistical anxiety and attitudes towards statistics questionnaire content (original Danish name: Holdninger og Forhold til Statistik—Revideret, HFS-R)
Danish | German | |
Item order in questionnaire, named by subscale | Indledende spørgsmål og instruktion Nedenfor er en række udsagn, som refererer til situationer i forbindelse med statistikundervisning, der kan skabe følelser af usikkerhed. Der er ingen rigtige eller forkerte svar – kun forskellige. Sæt en ring om det tal, der angiver hvor høj en grad af usikkerhed, du ville føle i hver af de følgende situationer - Vær umiddelbar i dine svar og tænk ikke for længe over hver enkelt situation. Svar-skala: ingen usikkerhed (1), lidt usikkerhed (1), nogen usikkerhed (3), stor usikkerhed (4) | Einleitende Fragen und Anweisungen Im Folgenden finden Sie eine Reihe von Aussagen, die sich auf Situationen in einer Statistik- Lehrveranstaltung beziehen und ein Gefühl von Unsicherheit hervorrufen können. Es gibt keine richtigen oder falschen Antworten - nur unterschiedliche. Bitte kreuzen Sie die diejenige Antwortoption an, die angibt, wie unsicher Sie sich in jeder der folgenden Situationen fühlen würden - Bitte antworten Sie sofort und denken Sie nicht zu lange über die beschriebene Situation nach. Antwortmöglichkeiten: Gar nicht unsicher (1), Ein wenig unsicher (1), Ziemlich unsicher (3), Sehr unsicher (4) |
Items | Items | |
TCA1 | At læse op til og forberede mig til eksamen i et statistikkursus | Vorbereitung auf eine Prüfung in einer Statistik-Lehrveranstaltung |
IA1 | At fortolke en tabel i en forskningsartikel | Interpretieren einer Tabelle in einer wissenschaftlichen Publikation |
FAH1 | At opsøge min underviser i statistik for at bede om individuel hjælp med noget, som jeg har svært ved at forstå | Zur Statistik-Lehrperson gehen und um Unterstützung bei etwas bitten, das ich nicht so gut verstehe |
TCA2 | At forberede mig til undervisningen og øvelser i et statistikkursus | Vorbereitung auf Unterricht und Übungen in einer Statistik-Lehrveranstaltung |
IA2 | At træffe en beslutning baseret på statistisk analyse | Eine Entscheidung auf der Grundlage statistischer Analysen treffen |
IA3 | At læse en forskningsartikel, der indeholder statistiske analyser | Lesen einer wissenschaftlichen Publikation, die statistische Analysen enthält |
IA4 | At beslutte hvilken analyse, der er passende i en opgave | Ein passendes statistisches Analyseverfahren für eine Aufgabe auswählen |
TCA3 | At tage den afsluttende eksamen i et statistikkursus | Teilnahme an der Abschlussprüfung in einer Statistik-Lehrveranstaltung |
IA5 | At læse og fortolke output fra en statistisk analyse | Den Output einer statistischen Analyse lesen und verstehen |
TCA4 | At deltage i øvelser i statistik | Teilnahme an Übungen in Statistik |
IA6 | At fortolke en sandsynlighedsværdi, når jeg har beregnet den | Interpretieren einer Wahrscheinlichkeit, nachdem man sie berechnet hat |
FAH2 | At spørge om hjælp til at foretage analyser i øvelsestimerne | Während den Übungen um Hilfe bei statistischen Analysen bitten |
TCA5 | At opdage, at en medstuderende er nået frem til en anden løsning i en analyse | Feststellen, dass ein:e Mitstudent:in eine andere Lösung bei einer statistischen Aufgabe hat als man selbst |
IA7 | At beslutte, om jeg skal afvise eller acceptere nulhypotesen | Entscheiden, ob die Nullhypothese verworfen oder beibehalten werden soll |
FAH3 | At spørge en af mine undervisere om hjælp til at forstå output i timerne | Die Statistik-Lehrperson während der Lehrveranstaltung um Hilfe beim Verstehen eines statistischen Outputs bitten |
IA8** | At se en medstuderende nærlæse outputtet fra øvelsesopgaver | Sehen, dass ein:e Mitstudent:in in den Output einer statistischen Analyse vertieft ist |
FAH4 | At bede om en forklaring på noget jeg ikke forstår i statistikforelæsningen | Während der Statistik-Vorlesung um eine Erklärung für etwas bitten, das ich nicht verstehe |
TCA7 | At overvære forelæsninger i statistik | Statistik-Vorlesungen besuchen |
TCA8** | At gennemgå en eksamensopgave i statistik, efter bedømmelsen /karakteren er givet | Nochmaliges Durchschauen einer Statistik-Prüfung, nachdem die Note vergeben wurde |
FAH5 | At spørge en medstuderende om hjælp til at forstå output | Eine:n Mitstudent:in um Hilfe beim Verstehen eines statistischen Outputs bitten |
Indledende spørgsmål og instruktion Nedenfor er en række udsagn omkring den oplevede værdi af statistik. Der er ingen rigtige eller forkerte svar – kun forskellige. Svarskala: Absolut uenig (1), Mere uenig end enig (2), Mere enig end uenig (3), Absolut enig (4) | Einleitende Fragen und Anweisungen Im Folgenden finden Sie eine Reihe von Aussagen darüber, wie Sie die Bedeutung von Statistik einschätzen. Es gibt keine richtigen oder falschen Antworten - nur unterschiedliche. Antwortmöglichkeiten: Stimme gar nicht zu (1), Stimme eher nicht zu (2), Stimme eher zu (3), Stimme völlig zu (4) | |
WS2 | Jeg kan godt lide at arbejde med empiri | Ich mag es, empirisch zu arbeiten |
WS3r | Statistik er for tidskrævende i forhold til, hvad jeg får ud af det | Statistik ist zu zeitaufwändig im Verhältnis dazu, was es mir bringt |
WS5 | Statistik er nyttigt | Statistik ist nützlich |
WS6 | Statistik er interessant | Statistik ist interessant |
WS7 | Statistik er en uundværlig del af mit studium | Statistik ist ein unverzichtbarer Teil meines Studiums |
WS8** | Statistik giver den mest objektive og solide viden | Statistik liefert das objektivste und solideste Wissen |
Table A2 – part 1
Distribution of items responses in the total as well as the Danish and Swiss subsamples
| Total Sample | Danish Subsample | Swiss Subsample | ||||||||||||
Items | No anxiety | A little anxiety | Some anxiety | A lot of anxiety | Missing | No anxiety | A little anxiety | Some anxiety | A lot of anxiety | Missing | No anxiety | A little anxiety | Some anxiety | A lot of anxiety | Missing |
TCA1 | 102 (12.7%) | 424 (52.8%) | 209 (26.03%) | 67 (8.34%) | 1 (0.12%) | 48 (10.79%) | 201 (45.17%) | 147 (33.03%) | 48 (10.79%) | 1 (0.22%) | 54 (15.08%) | 223 (62.29%) | 62 (17.32%) | 19 (5.31%) | 0 (0%) |
TCA2 | 356 (44.33%) | 346 (43.09%) | 91 (11.33%) | 10 (1.25%) | 0 (0%) | 179 (40.22%) | 200 (44.94%) | 58 (13.03%) | 8 (1.8%) | 0 (0%) | 177 (49.44%) | 146 (40.78%) | 33 (9.22%) | 2 (0.56%) | 0 (0%) |
TCA3 | 45 (5.6%) | 305 (37.98%) | 269 (33.5%) | 172 (21.42%) | 12 (1.49%) | 22 (4.94%) | 114 (25.62%) | 176 (39.55%) | 129 (28.99%) | 4 (0.9%) | 23 (6.42%) | 191 (53.35%) | 93 (25.98%) | 43 (12.01%) | 8 (2.23%) |
TCA4 | 385 (47.95%) | 328 (40.85%) | 70 (8.72%) | 11 (1.37%) | 9 (1.12%) | 206 (46.29%) | 176 (39.55%) | 54 (12.13%) | 8 (1.8%) | 1 (0.22%) | 179 (50%) | 152 (42.46%) | 16 (4.47%) | 3 (0.84%) | 8 (2.23%) |
TCA5 | 159 (19.8%) | 395 (49.19%) | 190 (23.66%) | 49 (6.1%) | 10 (1.25%) | 101 (22.7%) | 209 (46.97%) | 109 (24.49%) | 26 (5.84%) | 0 (0%) | 58 (16.2%) | 186 (51.96%) | 81 (22.63%) | 23 (6.42%) | 10 (2.79%) |
TCA7 | 585 (72.85%) | 154 (19.18%) | 40 (4.98%) | 7 (0.87%) | 17 (2.12%) | 298 (66.97%) | 108 (24.27%) | 34 (7.64%) | 5 (1.12%) | 0 (0%) | 287 (80.17%) | 46 (12.85%) | 6 (1.68%) | 2 (0.56%) | 17 (4.75%) |
TCA8 | 338 (42.09%) | 324 (40.35%) | 90 (11.21%) | 27 (3.36%) | 24 (2.99%) | 172 (38.65%) | 189 (42.47%) | 65 (14.61%) | 12 (2.7%) | 7 (1.57%) | 166 (46.37%) | 135 (37.71%) | 25 (6.98%) | 15 (4.19%) | 17 (4.75%) |
IA1 | 106 (13.2%) | 413 (51.43%) | 238 (29.64%) | 46 (5.73%) | 0 (0%) | 43 (9.66%) | 200 (44.94%) | 162 (36.4%) | 40 (8.99%) | 0 (0%) | 63 (17.6%) | 213 (59.5%) | 76 (21.23%) | 6 (1.68%) | 0 (0%) |
IA2 | 73 (9.09%) | 393 (48.94%) | 272 (33.87%) | 64 (7.97%) | 1 (0.12%) | 43 (9.66%) | 216 (48.54%) | 150 (33.71%) | 35 (7.87%) | 1 (0.22%) | 30 (8.38%) | 177 (49.44%) | 122 (34.08%) | 29 (8.1%) | 0 (0%) |
IA3 | 159 (19.8%) | 413 (51.43%) | 188 (23.41%) | 35 (4.36%) | 8 (1%) | 91 (20.45%) | 200 (44.94%) | 128 (28.76%) | 26 (5.84%) | 0 (0%) | 68 (18.99%) | 213 (59.5%) | 60 (16.76%) | 9 (2.51%) | 8 (2.23%) |
IA4 | 21 (2.62%) | 304 (37.86%) | 347 (43.21%) | 122 (15.19%) | 9 (1.12%) | 16 (3.6%) | 180 (40.45%) | 183 (41.12%) | 65 (14.61%) | 1 (0.22%) | 5 (1.4%) | 124 (34.64%) | 164 (45.81%) | 57 (15.92%) | 8 (2.23%) |
IA5 | 85 (10.59%) | 465 (57.91%) | 206 (25.65%) | 39 (4.86%) | 8 (1%) | 38 (8.54%) | 248 (55.73%) | 130 (29.21%) | 29 (6.52%) | 0 (0%) | 47 (13.13%) | 217 (60.61%) | 76 (21.23%) | 10 (2.79%) | 8 (2.23%) |
IA6 | 256 (31.88%) | 396 (49.32%) | 113 (14.07%) | 24 (2.99%) | 14 (1.74%) | 124 (27.87%) | 214 (48.09%) | 84 (18.88%) | 19 (4.27%) | 4 (0.9%) | 132 (36.87%) | 182 (50.84%) | 29 (8.1%) | 5 (1.4%) | 10 (2.79%) |
IA7 | 391 (48.69%) | 325 (40.47%) | 65 (8.09%) | 12 (1.49%) | 10 (1.25%) | 211 (47.42%) | 184 (41.35%) | 43 (9.66%) | 7 (1.57%) | 0 (0%) | 180 (50.28%) | 141 (39.39%) | 22 (6.15%) | 5 (1.4%) | 10 (2.79%) |
IA8 | 521 (64.88%) | 201 (25.03%) | 49 (6.1%) | 8 (1%) | 24 (2.99%) | 304 (68.31%) | 107 (24.04%) | 21 (4.72%) | 7 (1.57%) | 6 (1.35%) | 217 (60.61%) | 94 (26.26%) | 28 (7.82%) | 1 (0.28%) | 18 (5.03%) |
Table A2 – part 2.
Distribution of items responses in the total as well as the Danish and Swiss subsamples
| Total Sample | Danish Subsample | Swiss Subsample | ||||||||||||||||||||||||||||||||||||
Items | No anxiety | A little anxiety | Some anxiety | A lot of anxiety | Missing | No anxiety | A little anxiety | Some anxiety | A lot of anxiety | Missing | No anxiety | A little anxiety | Some anxiety | A lot of anxiety | Missing | ||||||||||||||||||||||||
FAH1 | 364 (45.33%) | 253 (31.51%) | 134 (16.69%) | 52 (6.48%) | 0 (0%) | 234 (52.58%) | 129 (28.99%) | 56 (12.58%) | 26 (5.84%) | 0 (0%) | 130 (36.31%) | 124 (34.64%) | 78 (21.79%) | 26 (7.26%) | 0 (0%) |
| |||||||||||||||||||||||
FAH2 | 506 (63.01%) | 199 (24.78%) | 70 (8.72%) | 16 (1.99%) | 12 (1.49%) | 340 (76.4%) | 77 (17.3%) | 22 (4.94%) | 5 (1.12%) | 1 (0.22%) | 166 (46.37%) | 122 (34.08%) | 48 (13.41%) | 11 (3.07%) | 11 (3.07%) |
| |||||||||||||||||||||||
FAH3 | 427 (53.18%) | 228 (28.39%) | 97 (12.08%) | 40 (4.98%) | 11 (1.37%) | 315 (70.79%) | 100 (22.47%) | 21 (4.72%) | 8 (1.8%) | 1 (0.22%) | 112 (31.28%) | 128 (35.75%) | 76 (21.23%) | 32 (8.94%) | 10 (2.79%) |
| |||||||||||||||||||||||
FAH4 | 266 (33.13%) | 230 (28.64%) | 193 (24.03%) | 98 (12.2%) | 16 (1.99%) | 172 (38.65%) | 112 (25.17%) | 94 (21.12%) | 67 (15.06%) | 0 (0%) | 94 (26.26%) | 118 (32.96%) | 99 (27.65%) | 31 (8.66%) | 16 (4.47%) |
| |||||||||||||||||||||||
FAH5 | 544 (67.75%) | 201 (25.03%) | 33 (4.11%) | 8 (1%) | 17 (2.12%) | 309 (69.44%) | 110 (24.72%) | 22 (4.94%) | 3 (0.67%) | 1 (0.22%) | 235 (65.64%) | 91 (25.42%) | 11 (3.07%) | 5 (1.4%) | 16 (4.47%) |
| |||||||||||||||||||||||
WS2 | 38 (4.73%) | 240 (29.89%) | 404 (50.31%) | 99 (12.33%) | 22 (2.74%) | 23 (5.17%) | 137 (30.79%) | 232 (52.13%) | 49 (11.01%) | 4 (0.9%) | 15 (4.19%) | 103 (28.77%) | 172 (48.04%) | 50 (13.97%) | 18 (5.03%) | ||||||||||||||||||||||||
WS3r | 41 (5.11%) | 172 (21.42%) | 396 (49.32%) | 169 (21.05%) | 25 (3.11%) | 30 (6.74%) | 101 (22.7%) | 225 (50.56%) | 82 (18.43%) | 7 (1.57%) | 11 (3.07%) | 71 (19.83%) | 171 (47.77%) | 87 (24.3%) | 18 (5.03%) | ||||||||||||||||||||||||
WS5 | 2 (0.25%) | 33 (4.11%) | 353 (43.96%) | 394 (49.07%) | 21 (2.62%) | 1 (0.22%) | 21 (4.72%) | 223 (50.11%) | 197 (44.27%) | 3 (0.67%) | 1 (0.28%) | 12 (3.35%) | 130 (36.31%) | 197 (55.03%) | 18 (5.03%) | ||||||||||||||||||||||||
WS6 | 76 (9.46%) | 206 (25.65%) | 384 (47.82%) | 115 (14.32%) | 22 (2.74%) | 45 (10.11%) | 125 (28.09%) | 215 (48.31%) | 56 (12.58%) | 4 (0.9%) | 31 (8.66%) | 81 (22.63%) | 169 (47.21%) | 59 (16.48%) | 18 (5.03%) | ||||||||||||||||||||||||
WS7 | 26 (3.24%) | 113 (14.07%) | 372 (46.33%) | 270 (33.62%) | 22 (2.74%) | 23 (5.17%) | 85 (19.1%) | 240 (53.93%) | 93 (20.9%) | 4 (0.9%) | 3 (0.84%) | 28 (7.82%) | 132 (36.87%) | 177 (49.44%) | 18 (5.03%) | ||||||||||||||||||||||||
WS8 | 52 (6.48%) | 220 (27.4%) | 408 (50.81%) | 90 (11.21%) | 33 (4.11%) | 46 (10.34%) | 143 (32.13%) | 214 (48.09%) | 27 (6.07%) | 15 (3.37%) | 6 (1.68%) | 77 (21.51%) | 194 (54.19%) | 63 (17.6%) | 18 (5.03%) | ||||||||||||||||||||||||
Table A3 shows item fit statistics comparing observed correlations between an item and the restscore over the remaining items with the expected correlations under the respective GLLRM. These are not the only item fit statistics calculated during the analysis, as conditional infit and outfit are also calculated (not included). However, the item-restscore correlations are particularly important because significant differences between observed and expected correlations may suggest that a discrimination parameter could be needed to improve the fit of the model to data. Under GLLRMs, the sum over locally dependent items have partial credit distributions, and thus Table A3 includes item fit statistics for these partial credit super-items. The TCA subscale has three pairs of locally dependent items (TCA1, TCA3), (TCA2, TCA4) and (TCA2, TCA7), and thus TCA1+TCA3 and TCA2+TCA4+TCA7 makes up partial credit super-items. The FAH subscale also includes three pairs of locally dependent items, (FAH1, FAH3), (FAH1, FAH2) and (FAH2, FAH3), making up a single partial credit super-item. In the IA subscale, locally dependent items are (IA2, IA5) and (IA5, IA6), thus forming a partial credit super-item of IA2+IA5+IA6. Lastly, the WS subscale has a single pair of locally dependent items, making up the super-item WS5+WS7.
There are weak significant differences in six cases (Table A3). The Benjamini-Hochberg procedure dismisses five cases, while the weak significance is maintained for item WS6. Thus, there is no evidence against the GLLRMs for the TCA, FAH and IA subscale, and only weak evidence against the WS GLLRM.
Table A3.
Item fit statistics as item-restscore correlations for the TCA, FAH, IA, and WS items to the respective graphical log-linear Rasch models
Test and Class Anxiety (TCA) | |||
items | observed g | expected g | p |
TCA1 | 0.64 | 0.65 | 0.669 |
TCA2 | 0.58 | 0.58 | 0.987 |
TCA3 | 0.65 | 0.62 | 0.319 |
TCA4 | 0.63 | 0.54 | 0.015+ |
TCA5 | 0.35 | 0.40 | 0.125 |
TCA7 | 0.53 | 0.54 | 0.740 |
TCA8 | - | - | - |
TCA 1+3 | 0.50 | 0.49 | 0.734 |
TCA 2+4+7 | 0.51 | 0.50 | 0.651 |
Fear of Asking for Help (FAH) | |||
items | observed g | expected g | p |
FAH1 | 0.73 | 0.75 | 0.385 |
FAH2 | 0.77 | 0.76 | 0.741 |
FAH3 | 0.78 | 0.75 | 0.230 |
FAH4 | 0.59 | 0.58 | 0.689 |
FAH5 | 0.52 | 0.55 | 0.425 |
FAH1+2+3 | 0.61 | 0.59 | 0.516 |
Interpretation Anxiety (IA) | |||
items | observed g | expected g | p |
IA1 | 0.57 | 0.53 | 0.203 |
IA2 | 0.62 | 0.60 | 0.601 |
IA3 | 0.51 | 0.54 | 0.383 |
IA4 | 0.45 | 0.52 | 0.027+ |
IA5 | 0.73 | 0.67 | 0.031+ |
IA6 | 0.61 | 0.60 | 0.813 |
IA7 | 0.52 | 0.52 | 0.974 |
IA8 | - | - | - |
IA2+5+6 | 0.65 | 0.59 | 0.006+ |
Worth of Statistics (WS) | |||
items | observed g | expected g | p |
WS2 | 0.52 | 0.58 | 0.038+ |
WS3R | 0.61 | 0.59 | 0.549 |
WS5 | 0.66 | 0.65 | 0.623 |
WS6 | 0.67 | 0.59 | 0.006++ |
WS7 | 0.58 | 0.60 | 0.518 |
WS8 | - | - | - |
WS5+6 | 0.58 | 0.59 | 0.912 |
Table A4 contains the results of testing whether the local dependence and/or DIF terms included in the respective GLLRMs are necessary and effect size or strength of each local dependence and DIF term in the form of standardized gamma correlation coefficients (i.e. coefficients taking into account the remaining local dependence and DIF in the model). The evidence for local dependency of items and DIF was very strong in all cases. In addition, most of the correlations were strong to very strong with a few correlations of moderate strength, mostly local dependence terms (TCA2 & TCA7, FAH2 & FAH3, IA2 & IA5, IA3 & Language, and WS5 & WS7). The gamma coefficient for the DIF term TCA & Subsample was negligible in strength (g = 0.04), but necessary to achieve fit of the data to the model.
Table A4.
Conditional likelihood ratio tests of local independence and no DIF under the GLLRMs for the four subscales of the FHF-R
LD and DIF terms within subscales | CLR | df | p | g |
Test and Class Anxiety | ||||
TCA1 & TCA3 | 165.24 | 9 | < 0.0001 | 0.66 |
TCA2 & TCA4 | 52.75 | 9 | < 0.0001 | 0.41 |
TCA2 & TCA7 | 32.13 | 9 | 0.0002 | 0.24 |
TCA3 & Subsample | 38.47 | 3 | < 0.0001 | -0.47 |
TCA4 & Subsample | 15.04 | 3 | 0.0018 | 0.04 |
TCA5 & Subsample | 20.76 | 3 | 0.0001 | 0.34 |
TCA7 & Subsample | 17.68 | 3 | 0.0005 | -0.46 |
Fear of Asking for Help | ||||
FAH1 & FAH2 | 30.98 | 9 | 0.0003 | 0.41 |
FAH1 & FAH3 | 60.62 | 9 | < 0.0000 | 0.47 |
FAH2 & FAH3 | 27.46 | 9 | 0.0012 | 0.28 |
FAH1 & Subsample | 34.57 | 3 | < 0.0001 | -0.71 |
FAH3 & Subsample | 13.38 | 3 | 0.0039 | 0.51 |
FAH4 & Subsample | 56.85 | 3 | < 0.0001 | -0.61 |
FAH5 & Subsample | 26.27 | 3 | < 0.0001 | -0.50 |
FAH1 & Course number | 11.98 | 3 | 0.0074 | 0.33 |
Interpretation Anxiety | ||||
IA2 & IA5 | 46.83 | 9 | < 0.0001 | 0.23 |
IA5 & IA6 | 28.98 | 9 | 0.0007 | 0.33 |
IA1 & Subsample | 54.25 | 3 | < 0.0001 | -0.57 |
IA3 & Subsample | 25.70 | 3 | < 0.0001 | -0.24 |
IA5 & Subsample | 27.66 | 3 | < 0.0001 | -0.43 |
IA5 & Course number | 22.13 | 3 | 0.0001 | -0.40 |
Worth of Statistics | ||||
WS5 & WS7 | 32.87 | 9 | 0.0001 | 0.23 |
WS7 & Subsample | 58.48 | 3 | < 0.0001 | 0.63 |
WS7 & Math | 19.60 | 3 | 0.0002 | 0.43 |
Table A5 shows the category thresholds for all items; conditionally independent items as well as the partial credit super items made up of locally dependent items. It is noticeable that local dependence of items creates reversed category thresholds for the super items in some cases.
Table A5.
Category thresholds, item difficulties, targets and information for conditionally independent items and partial credit super items made up of locally dependent items
| Thresholds | Midpoint | Target | Inf | |||||||||
| items within subscalesa | 1 | 2 | 3 | 4 | 5 | 6 | 7 | 8 | 9 | |||
| Test and Class Anxiety | ||||||||||||
| TCA5, Danish | -1.80 | 0.06 | 1.42 | -0.05 | 0.25 | 0.59 | ||||||
| TCA5, Swiss | -2.91 | -0.19 | 1.15 | -0.44 | 0.30 | 0.54 | ||||||
| TCA1+TCA3, Danish | -1.92 | -2.95 | -1.16 | -0.69 | -0.09 | 0.69 | -1.06 | -0.67 | 1.37 | |||
| TCA1+TCA3, Swiss | -3.11 | -3.14 | -0.26 | -0.45 | 0.64 | 0.75 | -0.58 | 0.05 | 1.43 | |||
| TCA2+TCA4+TCA7, Danish | -1.28 | -0.90 | -0.06 | 0.30 | 0.64 | 1.29 | 2.10 | 0.57 | 1.77 | 0.69 | 1.24 | 3.14 |
| TCA2+TCA4+TCA7, Swiss | -1.37 | -1.04 | 0.56 | 0.80 | 1.29 | 1.94 | 1.92 | 0.59 | 1.45 | 1.08 | 1.43 | 4.51 |
| Fear of Asking for Help | ||||||||||||
| FAH4, Danish | -2.06 | -1.47 | -0.82 | -1.45 | -1.46 | 0.95 | ||||||
| FAH4, Swiss | -2.00 | -0.30 | 1.47 | -0.29 | -0.36 | 0.55 | ||||||
| FAH5, Danish | -0.77 | 0.69 | --- | 1.08 | -0.04 | 0.49 | ||||||
| FAH5, Swiss | 0.22 | 2.55 | 2.45 | 1.95 | 2.35 | 0.79 | ||||||
| FAH1+FAH2+FAH3, Danish, 1st stat course | -1.27 | -1.37 | -1.10 | -0.36 | -0.12 | 0.28 | 0.72 | 1.12 | 1.24 | -0.10 | 0.11 | 2.47 |
| FAH1+FAH2+FAH3, Swiss, 1st stat course | -1.12 | -1.38 | -1.10 | 0.20 | 0.29 | 0.43 | 1.67 | 1.53 | 1.51 | 0.29 | 0.86 | 2.16 |
| FAH1+FAH2+FAH3, Danish, not 1st stat course | -1.40 | -1.63 | -1.28 | -0.76 | -0.36 | 0.24 | 0.50 | 1.07 | 1.22 | -0.31 | -0.97 | 2.33 |
| FAH1+FAH2+FAH3, Swiss, not 1st stat course | -1.17 | -1.48 | -1.19 | -0.13 | 0.07 | 0.29 | 1.41 | 1.33 | 1.38 | 0.07 | 0.68 | 2.13 |
| Interpretation Anxiety | ||||||||||||
| IA1, Danish | -2.98 | -0.25 | 1.95 | -0.32 | 0.38 | 0.42 | ||||||
| IA1, Swiss | -2.27 | 0.93 | 3.35 | 0.84 | 1.71 | 0.38 | ||||||
| IA3, Danish | -1.78 | 0.17 | 2.32 | 0.21 | -0.06 | 0.48 | ||||||
| IA3, Swiss | -2.14 | 1.19 | 2.84 | 0.95 | 1.90 | 0.48 | ||||||
| IA4 | -4.45 | -0.89 | 1.23 | -1.06 | 0.03 | 0.42 | ||||||
| IA7 | -0.42 | 1.96 | 3.11 | 1.71 | 2.29 | 0.58 | ||||||
| IA2+IA5+IA6, Danish, 1st stat course | -2.83 | -2.72 | -1.56 | -0.31 | 0.01 | 0.71 | 1.62 | 2.19 | 2.90 | 0.11 | 0.25 | 1.46 |
| IA2+IA5+IA6, Swiss, 1st stat course | -2.76 | -2.70 | -1.23 | -0.14 | 0.19 | 1.26 | 1.99 | 2.42 | 3.26 | 0.39 | 1.88 | 1.40 |
| IA2+IA5+IA6, Danish, not 1st stat course | -2.73 | -2.53 | -1.48 | -0.08 | 0.43 | 0.90 | 1.71 | 2.24 | 2.90 | 0.37 | 0.92 | 1.58 |
| IA2+IA5+IA6, Swiss, not 1st stat course | -2.65 | -2.51 | -1.15 | 0.14 | 0.67 | 1.38 | 2.03 | 2.45 | 3.26 | 0.67 | 1.68 | 1.58 |
Worth of Statistics | |||||||||||||
WS2 | -2.00 | 0.18 | 3.49 | 0.32 | -0.70 | 0.41 | |||||||
WS3r | -1.71 | -0.30 | 2.60 | -0.05 | -0.86 | 0.52 | |||||||
WS6 | -1.02 | 0.19 | 3.18 | 0.50 | -0.29 | 0.55 | |||||||
WS5+WS7, Danish, Math adequate | -3.75 | -2.30 | -1.77 | -0.26 | 1.16 | 2.31 | -0.91 | -1.96 | 0.95 | ||||
WS5+WS7, Swiss, Math adequate | -3.75 | -3.09 | -2.27 | -1.14 | 0.77 | 1.27 | -1.59 | -2.73 | 1.05 | ||||
WS5+WS7, Danish, Math inadequate | -3.75 | -2.12 | -1.65 | -1.37 | 0.94 | 1.79 | -1.27 | -1.73 | 1.27 | ||||
WS5+WS7, Swiss, Math inadequate | -3.75 | -2.79 | -2.40 | -2.23 | 0.48 | 0.93 | -2.01 | -2.57 | 1.45 | ||||
.png)
Figure A1.
Item maps showing distributions of person parameter locations and information curve above item threshold locations for DIF subgroups of students on the TCA subscale
.png)
Figure A2.
Item maps showing distributions of person parameter locations and information curve above item threshold locations for DIF subgroups of students on the FAH subscale
.png)
Figure A3.
Item maps showing distributions of person parameter locations and information curve above item threshold locations for DIF subgroups of students on the IA subscale
.png)
Figure A4.
Item maps showing distributions of person parameter locations and information curve above item threshold locations for DIF subgroups of students on the WS subscale.
The sample DIF in the TCA scale means that the direct effect of language on the TCA items has to be taken into account to make the scale scores comparable across language groups. To calculate such comparable scores, we first estimate the person parameters for the two language groups, based on the two sets of item parameters resulting for the DIF (i.e. splitting for DIF). We then selected Danish (the original language of the questionnaire) as the reference, and calculated the expected score for the other language group (German, i.e. the Swiss students) as if they had been Danish (i.e. that there was no DIF and the item parameters were identical for the two language groups). Results are shown in Table A6.
DIF-equating was done in the same manner for the FAH scale (Table A7), the IA scale (Table A8) and the WS scale (Table A9), whenever DIF was present.
The degree to which the differences between the observed and DIF equated scores are important depends on the application of the results. In this case, about one point should be added to scores above 13-14 in age groups 21 and 22+ to make them comparable with scores in the reference group. Table 3 in the article compares the averages of observed and DIF equated scores in the three age groups.
Table A6.
DIF-equation for the TCA sum score to adjust for sample DIF
Danish | Swiss |
Raw score | DIF-equated score |
6.00 | 6.00 |
7.00 | 6.46 |
8.00 | 7.25 |
9.00 | 8.50 |
10.00 | 9.92 |
11.00 | 11.31 |
12.00 | 12.65 |
13.00 | 13.91 |
14.00 | 15.09 |
15.00 | 15.00 |
16.00 | 16.29 |
17.00 | 17.29 |
18.00 | 19.20 |
19.00 | 19.99 |
20.00 | 10.71 |
21.00 | 21.38 |
22.00 | 22.08 |
23.00 | 22.90 |
24.00 | 24.00 |
Table A7.
DIF-equation for the FAH sum score to adjust for course number and sample DIF
1st statistics course | not 1st statistics course | ||
Danish | Swiss | Danish | Swiss |
Raw score | DIF-equated score | DIF-equated score | DIF-equated score |
5.00 | 5.00 | 5.00 | 5.00 |
6.00 | 6.41 | 5.93 | 6.35 |
7.00 | 7.87 | 6.81 | 7.70 |
8.00 | 9.28 | 7.67 | 9.00 |
9.00 | 10.67 | 8.55 | 10.29 |
10.00 | 12.00 | 9.47 | 11.55 |
11.00 | 13.25 | 10.43 | 12.75 |
12.00 | 14.37 | 11.45 | 13.88 |
13.00 | 15.40 | 12.50 | 14.95 |
14.00 | 16.29 | 13.57 | 15.91 |
15.00 | 17.03 | 14.66 | 16.74 |
16.00 | 17.61 | 15.75 | 17.41 |
17.00 | 18.07 | 16.86 | 17.96 |
18.00 | 18.44 | 17.95 | 18.40 |
19.00 | 18.74 | 19.00 | 18.73 |
20.00 | 20.00 | 20.00 | 20.00 |
Table A8.
DIF-equation for the IA sum score to adjust for course number and sample DIF
1st statistics course | not 1st statistics course | ||
Danish | Swiss | Danish | Swiss |
Raw score | DIF-equated score | DIF-equated score | DIF-equated score |
7.00 | 7.00 | 7.00 | 7.00 |
8.00 | 8.08 | 8.03 | 8.12 |
9.00 | 9.17 | 9.08 | 9.27 |
10.00 | 10.25 | 10.13 | 10.39 |
11.00 | 11.33 | 11.15 | 11.49 |
12.00 | 12.43 | 12.15 | 12.60 |
13.00 | 13.56 | 13.17 | 13.76 |
14.00 | 14.71 | 14.21 | 14.98 |
15.00 | 15.87 | 15.27 | 16.23 |
16.00 | 17.03 | 16.34 | 17.45 |
17.00 | 18.17 | 17.37 | 18.59 |
18.00 | 19.27 | 18.38 | 19.64 |
19.00 | 20.33 | 19.34 | 20.63 |
20.00 | 21.35 | 20.28 | 21.57 |
21.00 | 22.32 | 21.22 | 22.48 |
22.00 | 23.26 | 22.16 | 23.36 |
23.00 | 24.15 | 23.11 | 24.21 |
24.00 | 25.00 | 24.07 | 25.04 |
25.00 | 25.82 | 25.04 | 25.84 |
26.00 | 26.60 | 26.02 | 26.61 |
27.00 | 27.33 | 27.00 | 27.34 |
28.00 | 28.00 | 28.00 | 28.00 |
Table A9.
DIF-equation for the WS sum score to adjust for DIF related to perceived adequacy of mathematics level to learn statistics and sample
Mathematics level adequate | Mathematics level inadequate | ||
Danish | Swiss | Danish | Swiss |
Raw score | DIF-equated score | DIF-equated score | DIF-equated score |
5.00 | 5.00 | 5.00 | 5.00 |
6.00 | 5.84 | 6.03 | 5.88 |
7.00 | 6.60 | 7.05 | 6.61 |
8.00 | 7.45 | 7.99 | 7.32 |
9.00 | 8.40 | 8.87 | 8.08 |
10.00 | 9.42 | 9.74 | 8.97 |
11.00 | 10.46 | 10.63 | 9.99 |
12.00 | 11.49 | 11.59 | 11.08 |
13.00 | 12.51 | 12.60 | 12.16 |
14.00 | 13.52 | 13.64 | 13.21 |
15.00 | 14.50 | 14.69 | 14.23 |
16.00 | 15.51 | 15.73 | 15.29 |
17.00 | 16.58 | 16.78 | 16.43 |
18.00 | 17.74 | 17.86 | 17.66 |
19.00 | 18.89 | 18.94 | 18.87 |
20.00 | 20.00 | 20.00 | 20.00 |
Table A10.
Response distributions for the eliminated item TCA8 within language samples
TCA8: Going through an exam assignment in statistics after the grade has been given | |||||
sample | no anxiety | a little anxiety | some anxiety | a lot of anxiety | total |
Danish | 172 (39.3%) | 189 (43.2%) | 65 (14.8%) | 12 (2.7%) | 438 (100.0%) |
Swiss | 166 (48.7%) | 135 (39.6%) | 25 (7.3%) | 15 (4.4%) | 341 (100.0%) |
Total | 338 (43.4%) | 324 (41.6%) | 90 (11.6%) | 27 (3.5%) | 779 (100.0%) |
Notes. Significance test done with 1000 Monte Carlo
Table A11.
Response distributions for the eliminated item IA8 within language samples
IA8: Seeing a fellow student concentrating on their output from statistical analyses | |||||
sample | no anxiety | a little anxiety | some anxiety | a lot of anxiety | total |
Danish | 304 (69.2%) | 107 (24.4%) | 21 (4.8%) | 7 (1.6%) | 439 (100.0%) |
Swiss | 217 (63.8%) | 94 (27.6%) | 28 (8.2%) | 1 (0.3%) | 340 (100.0%) |
Total | 521 (66.9%) | 201 (25.8%) | 49 (6.3%) | 8 (1.0%) | 779 (100.0%) |
Notes. .030 (99% confidence interval on p value is 0.019-0.047).
Table A12.
Response distributions for the eliminated item WS8 within language samples
WS8: Statistics provides the most objective and firm knowledge | |||||
sample | definitely disagree | disagree more than agree | agree more than disagree | definitely agree | total |
Danish | 46 (10.7%) | 143 (33.3%) | 214 (49.8%) | 27 (6.3%) | 430 (100.0%) |
Swiss | 6 (1.8%) | 77 (22.6%) | 194 (57.1%) | 63 (18.5%) | 340 (100.0%) |
Total | 52 (6.8%) | 220 (28.6%) | 408 (53.0%) | 90 (11.7%) | 770 (100.0%) |
Notes. Significance test done on p value is 0.000-0.007).
References
Andersen, E. B. (1973). A goodness of fit test for the Rasch model. Psychometrika, 38(1), 123–140. https://doi.org/10.1007/BF02291180
Baloǧlu M. (2003). Individual differences in statistics anxiety among college students. Personality and Individual Differences, 34(5), 855–65. . https://doi.org/10.1016/S0191-8869(02)00076-4
Benjamini, Y., & Hochberg, Y. (1995). Controlling the false discovery rate: A practical and powerful approach to multiple testing. Journal of the Royal Statistical Society. Series B (Methodological), 57(1), 289–300. Retrieved from: http://www.jstor.org/stable/2346101
Borsboom, D. (2005). Measuring the mind. Conceptual issues in contemporary psychometrics. Cambrige University Press. https://doi.org/10.1017/CBO9780511490026
Chew, P. K., & Dillon, D. B. (2014). Statistics anxiety update: Refining the construct and recommendations for a new research agenda. Perspectives on Psychological Science, 9(2), 196–208. https://doi.org/10.1177/1745691613518077
Christensen, K.B., & Kreiner, S. (2013). Item fit statistics. In Christensen, K. B., Kreiner, S., & Mesbah, M. (Eds.) Rasch models in health (pp. 83–104). John Wiley & Sons.. https://doi.org/10.1002/9781118574454.ch1
Christensen, K.B., Kreiner, S., & Mesbah, M. (2013). Rasch models in Health. John Wiley & Sons. https://doi.org/10.1002/9781118574454
Cox, D. R., Spjøtvoll, E., Johansen, S., van Zwet, W.R., Bithell, J.F., Barndorff-Nielsen, O. & Keuls, M. (1977). The role of significance tests [with discussion and reply]. Scandinavian Journal of Statistics, 4(2), 49–70. Retrieved from http://www.jstor.org/stable/4615652
Cruise, R. J., Cash, R. W., & Bolton, D. L. (1985). Development and validation of an instrument to measure statistical anxiety. Paper Presented at the Proceedings of the American Statistical Association.
Cruise, R. J., & Wilkins, E. M. (1980). STARS: Statistical anxiety rating scale, Unpublished manuscript, Andrews University, Berrien Springs, MI.
DeVaney, T. A. (2016). Confirmatory factor analysis of the statistical anxiety rating scale with online graduate students. Psychological Reports, 118(2), 565–586. https://doi.org/10.1177/0033294116644093
Fischer, G. H. (1995). Derivations of the Rasch model. In Fischer, G. H. & Molenaar, I. W. (Eds.) (1995). Rasch models – Foundations, recent developments, and applications. (pp. 15-38). Springer-Verlag. https://doi.org/10.1007/978-1-4612-4230-7_2
Fischer, G. H., & Molenaar, I. W. (Eds.) (1995). Rasch models – Foundations, recent developments, and applications.Springer-Verlag. https://doi.org/10.1007/978-1-4612-4230-7
Fullerton, J. A., & D. Umphrey (2001). An analysis of attitudes toward statistics: Gender differences among advertising majors. Paper presented at the 84th Annual Meeting of the Association for Education in Journalism and Mass Communication, Washington, DC, USA. Available from the National Library of Australia at https://catalogue.nla.gov.au/catalog/5684397
Hagquist, C., Bruce, M., & Gustavsson, J. P. (2009). Using the Rasch model in nursing research: An introduction and illustrative example. International Journal of Nursing Studies, 46, 380–393. 10.1016/j.ijnurstu.2008.10.007
Hamon, A., & Mesbah, M. (2002). Questionnaire reliability under the Rasch model. In Mesbah M., Cole, B. F., & Lee, M. L. T., (Eds.), Statistical methods for quality of life studies: Design, measurement and analysis. Kluwer . https://doi.org/10.1007/978-1-4757-3625-0_13
Hanson, B. (1998). Uniform DIF and DIF defined by differences in item response functions. Journal of Educational and behavioural Statistics, 23(3), 244–253. https://doi.org/10.3102/10769986023003244
Holland, P. W., & Wainer, H. (1993). Differential item functioning. Routledge.
Horton, M., Marais, I., & Christensen, K. B. (2013). Dimensionality. In Christensen, K. B., Kreiner S., & Mesbah M. (Eds.) Rasch models in Health (pp. 137–158). John Wiley & Sons. . https://doi.org/10.1002/9781118574454.ch9
Hunt, B. W., Mari. T., Knibb, G., Christiansen, P., & Jones, A. (2023). Statistics anxiety and predictions of exam performance in UK psychology students. PLoS ONE 18(8): e0290467. https://doi.org/10.1371/journal.pone.0290467
Kelderman, H. (1984). Loglinear Rasch model tests. Psychometrika, 49, 223–45. https://doi.org/10.1007/BF02294174
Kesici, Ş., Baloğlu, M., & Deniz, M. E. (2011). Self-regulated learning strategies in relation with statistics anxiety. Learning and Individual Differences, 21(4), 472–477. https://doi.org/10.1016/j.lindif.2011.02.006
Kreiner, S. (2003). Introduction to DIGRAM. Research report 3/10, 0909-6337. Copenhagen: Department of Biostatistics, University of Copenhagen. Available from the Royal Danish Library at https://soeg.kb.dk/discovery/fulldisplay?docid=alma99122372081705763&context=L&vid=45KBDK_KGL:KGL&lang=da&search_scope=MyInst_and_CI&adaptor=Local%20Search%20Engine&tab=Everything&query=any,contains,99122372081705763
Kreiner, S. (2007). Validity and objectivity: Reflections on the role and nature of Rasch models. Nordic Psychology, 59, 268–298. https://doi.org/10.1027/1901-2276.59.3.268
Kreiner, S. (2011). A note on item–restscore association in Rasch models. Applied Psychological Measurement, 35(7), 557-561. https://doi.org/10.1177/0146621611410227
Kreiner, S. (2013). The Rasch model for dichotomous items. In Christensen, K. B., Kreiner, S., & Mesbah, M. (Eds.), Rasch Models in Health (pp. 5–26). John Wiley & Sons.
Kreiner, S., & Christensen, K. B. (2002). Graphical Rasch models. In Mesbah, M.. Cole, B. F., & Lee, M-LT. (Eds). Statistical methods for quality of life studies: Design, measurements and analysis (pp. 187–203). Springer . https://doi.org/10.1007/978-1-4757-3625-0_15
Kreiner, S., & Christensen, K. B. (2004). Analysis of local dependence and multidimensionality in graphical loglinear Rasch models. Communication in Statistics –Theory and Methods, 33(6), 1239–1276. https://doi.org/10.1081/STA-120030148
Kreiner, S., & Christensen, K. B. (2007). Validity and objectivity in health-related scales: Analysis by graphical loglinear Rasch models. In von Davier, M. & Carstensen, C. (Eds.), Multivariate and mixture distribution Rasch models (pp. 329–346). Springer. https://doi.org/10.1007/978-0-387-49839-3_21.
Kreiner, S. & Christensen, K. B. (2013). Person parameter estimation and measurement in Rasch models. In Christensen, K. B., Kreiner, S., & Mesbah, M. (Eds.) Rasch models in health (pp. 63–78). John Wiley & Sons.. https://doi.org/10.1002/9781118574454.ch4
Kreiner, S. & Nielsen, T. (2013). Item analysis in DIGRAM 3.04. Part I: Guided tours. Research report 2013/06. University of Copenhagen, Department of Public Health. https://researchprofiles.ku.dk/da/publications/item-analysis-in-digram-304-part-i-guided-tours
Kreiner, S. & Nielsen, T. (2023). Item analysis in DIGRAM 5.01. Guided tours. Department of Biostatistics, University of Copenhagen. https://biostat.ku.dk/DIGRAM/Item%20analysis%20in%20DIGRAM%205-01%20-%20guided%20tours.pdf
Lauritzen, S. L. (1996). Graphical Models. Clarendon Press, London. ISBN: 9780198522195
LimeSurvey GmbH. (n.d.) LimeSurvey: An open source survey tool. https://www.limesurvey.org
Macher, D., Paechter, M., Papousek, I., & Ruggeri, K. (2011). Statistics anxiety, trait anxiety, learning behavior, and academic performance. European Journal of Psychology of Education, 27(4), 483–498. https://doi.org/10.1007/s10212-011-0090-5
Macher, D., Paechter, M., Papousek, I., Ruggeri, K., Freudenthaler, H. H., & Arendasy, M. (2013). Statistics anxiety, state anxiety during an examination, and academic achievement. British Journal of Educational Psychology, 83(4), 535–549. https://doi.org/10.1111/j.2044-8279.2012.02081.x
Masters, G. N. (1982). A Rasch model for partial credit scoring. Psychometrika, 47, 149–174.
Merenda, P. F. (2005). Cross-cultural adaptation of educational and psychological testing. Hambleton, R. K., Merenda, P. F, & Spielberger, C. D. (Eds). Adapting educational and psychological tests for cross-cultural assessment (pp.321-342). Lawrence Earlbaum Associate Publisher. https://doi.org/10.4324/9781410611758
Mesbah, M., & Kreiner, S. (2013). The Rasch model for ordered polytomous items. In Christensen, K. B., Kreiner, S., & Mesbah, M. (Eds.) Rasch models in health (pp. 27-42). John Wiley & Sons.
Nielsen, T., & Kreiner, S. (2018). Measuring Statistical Anxiety and Attitudes Towards Statistics: Development of a Comprehensive Danish Instrument (HFS-R). Cogent Education, 5(1). https://doi.org/10.1080/2331186X.2018.1521574
Nielsen, T., & Kreiner, S. (2021a): Statistical Anxiety and Attitudes Towards Statistics: criterion-related construct validity of the HFS-R questionnaire revisited using Rasch models. Cogent Education, 8(1): 1947941. https://doi.org/10.1080/2331186X.2021.1947941
Nielsen, T., & Kreiner, S. (2021b). Holdninger og Forhold til Statistik – Revideret spørgeskema (HFS-R). Danske professionshøjskoler. https://www.ucviden.dk/da/publications/holdninger-og-forhold-til-statistik-revideret-sp%C3%B8rgeskema-hfs-r
Nielsen, T. & Santiago, P. H. R. (2020). Using graphical loglinear Rasch models to investigate the construct validity of the Perceived Stress Scale. In Khine, M. (Ed.) Rasch Measurement: Applications in Quantitative Educational Research. (pp. 261-281). Springer Nature.
Onwuegbuzie, A. J., & Wilson, V. A. (2003). Statistics anxiety: Nature, etiology, antecedents, effects, and treatments—a comprehensive review of the literature. Teaching in Higher Education, 8(2). 195–209. https://doi.org/10.1080/1356251032000052447
Onwuegbuzie, A. J. (2004). Academic procrastination and statistics anxiety. Assessment & Evaluation in Higher Education, 29(1), 3–19. https://doi.org/10.1080/0260293042000160384
Papousek, I., Ruggeri, K., Macher, D., Paechter, M., Heene, M., Weiss, E. M., . . . Freudenthaler, H. (2012). Psychometric evaluation and experimental validation of the statistics anxiety rating scale. Journal of Personality Assessment, 94(1), 82–91. https://doi.org/10.1080/00223891.2011.627959
Ralston, K., McInnes, J., Crow, G., & Gayle, V. (2016). We need to talk about statistical anxiety. A review of the evidence around statistical anxiety in the context of quantitative methods pedagogy. National Centre for Research Methods Working Paper 4/16. Available at: https://eprints.ncrm.ac.uk/id/eprint/3987/1/anxiety_literature_WP4_16.pdf
Rasch, G. (1960). Probabilistic models for some intelligence and attainment tests. Danish Institute for Educational Research.
Rasch, G. (1961). On general laws and the meaning of measurement in psychology. The Regents of the University of California. Available at: http://projecteuclid.org/euclid.bsmsp/1200512895
Rasch, G. (1966). An individualistic approach to item analysis. In: Lazarsfeld, P. F., & Henry, N. W. (Eds). Readings in mathematical social science. (pp. 89-108). Science Research Associates, 89-108. ISBN: 9780262620109
Rosenbaum, P. R. (1989). Criterion-related construct validity. Psychometrika, 54, 625 – 633. https://doi.org/10.1007/BF02296400
Schau, C. Stevens, J., Dauphinee, T., & and Vecchio, A. D. (1995). The development and validation of the survey of attitudes toward statistics. Educational and Psychological Measurement 55(5), 868–875. https://doi.org/10.1177/0013164495055005022
Sesé, A., Jinmenez, R., Montaño, J. J., & Palmer, A. (2015). Can attitudes toward statistics and statistics anxiety explain students’ performance? Revista de Psicodidáctica/Journal of Psychodidactics, 20(2), 285-304. Available at: https://ojs.ehu.eus/index.php/psicodidactica/article/view/13080
Teman, E. D. (2013). A Rasch analysis of the statistical anxiety rating scale. Journal of Applied Measurement, 14(4), 414–434.
van der Linden, W. J. & Hambleton, R. K. (1995). Handbook of modern item response theory., Springer-Verlag.
Wise, S. L. (1985). The development and validation of a scale measuring attitudes toward statistics. Educational and Psychological Measurement 45(2), 401–405. https://doi.org/10.1177/001316448504500226
Wright, B. D., & Panchapakesan, N. (1969). A procedure for sample-free item analysis. Educational and Psychological Measurement, 29, 23-48. https://doi.org/10.1177/001316446902900102
Zeidner, M. (1991). Statistics and mathematics anxiety in social science students: Some interesting parallels. British Journal of Educational Psychology, 61(3), 319–328.https://doi.org/10.1111/j.2044-8279.1991.tb00989.x
