Full Html
Full Html
1. Introduction
Critical thinking has been identified as one of three most important outcomes of first-year student success (the others are academic achievement and social-emotional well-being outcomes) (van der Zanden et al., 2018). Van der Zanden et al.’s (2018) systematic review found large effect sizes for students’ pre-university critical thinking as a predictor of students’ critical thinking in the first year at university (i.e. d ≥ 0.80, η2 ≥ 0.14, r2 ≥ 0.26, β ≥ 0.50, based on guidelines by Cohen (1988) and Tabachnick & Fidell (2007). Huber and Kuncel’s (2016) meta-analysis found that the average effect of the university experience on students’ levels of critical thinking increased with time in university; from 0.03 SD after one year to 0.46 SD after four years. Effects after one, two and three years were insignificant.. Meta-analysis and review findings thus points to a continued development from before university and across the university experience (Huber & Kuncel, 2016; van der Zanden et al., 2018), although this is not always the case in specific educational contexts. A more recent primary study for example, did not find a change in the domain-specific critical thinking of psychology students in relation to the subject of statistics. Although students’ critical thinking changed substantially over the first semester of study, it changed in both directions at the individual level, resulting in a small overall effect size (Cohen, 1988; Nielsen et al., 2022). Such results underline the influence of educational context (context specificity), and the dynamic nature or malleability of students’ perception of their own critical thinking skills.
Critical thinking has been defined as thinking which may involve inductive/deductive reasoning, and analysis of information, evaluation, judgement, problem solving, decision making, etc., in relation to evidence, claims, arguments and so on (van der Zanden et al., 2018). While definitions of critical thinking vary in their focus on specific aspects (e.g. Facione, 1990; Halpern, 2003; Khan, 2017; Petress, 2004; Pintrich et al., 1991), there is also agreement on what the core aspect of critical thinking are across these definitions: critical thinking is in essence concerned with questioning subject matter and making own decisions, evaluating theory, interpretations and conclusions, and evaluating alternatives (Nielsen et al., 2021; 2022). Such variations in definitions may also be at the root of differences in results when it comes to development of critical thinking throughout the university experience. While no previous studies evaluating whether different instruments based on different definitions of critical thinking would lead to different results could be identified, we find it resonable to pressume that different instrument would indeed lead to different results.
Several definitions of critical thinking are closely connected with a specific assessment instrument, and different instruments are used depending on the purpose of the study in question. For example, the Critical Thinking Appraisal (WGCTA; Watson & Glaser, 1964) and the California Critical Thinking Skills Test (CCTST; Facione, 1991) have often been used in studies emphasizing individual assessment of detailed critical thinking profiles of higher education students (Staib, 2003; Facione, 1991). Both the WGCTA and the CCTST are complex instruments with 80 and 34 items, respectively, and they both require 45-60 minutes to complete the assessment. As such, they are detailed enough for achieving detailed profile information, but at the same time too resource demanding for larger N studies, or studies including many constructs to be measured. At the other end of the complexity spectrum, are the critical thinking scale from the Motivated Strategies for Learning Questionnaire (MLSQ; Pintrich et al., 1991) and a brief version of it (Nielsen et al., 2021), which consists of five and three items, respectively. These instruments appeal to usage in larger survey studies which include (several) other measures and/or include a large sample (e.g. Crede & Phillips, 2011; Duncan & McKeachie, 2005; Makransky et al., 2017; Nielsen et al., 2021; Nielsen et al., 2022), although they are not for detailed profiling.
The original MLSQ critical thinking scale (Pintrich et al., 1991) has been translated into more than 15 languages (Holland et al., 2018; Makransky et al., 2017; Nielsen et al., 2021), and it has been used to assess higher education students’ course-specific critical thinking as part of their meta-cognitive learning strategies (Crede & Phillips, 2011; Duncan & McKeachie, 2005). It was translated into Danish by Makransky et al. (2017) and used as an outcome in a study on the predictive validity of using admissions testing in higher education. They found that students admitted based on admission testing scored significantly higher on critical thinking and had significantly lower levels of dropout compared to students admitted based solely on grades. Makransky et al. (2017) reported that the Danish language version of the critical thinking scale was validated using the Partial Credit model (PCM; Masters, 1982), which is one parameterization of the implementation of the Rasch model (Rasch, 1960) for ordinal data. However, the psychometric properties of the Danish version of the MLSQ critical thinking scale were not documented, and no considerations about the content validity of the items of the scale were reported.
The MLSQ critical thinking scale (Pintrich et al., 1991) was translated into Spanish from Danish for a cross-cultural validation study, which aimed to test whether this brief scale could be used to compare critical thinking of higher education students from the two countries with similar disciplines (Nielsen et al., 2021). The study used Rasch models for the psychometric validation and included a thorough investigation of content validity. Nielsen et al. (2021) found that the MSLQ critical thinking scale contained two content-irrelevant items. A finding that was supported strongly by the psychometric evidence. Upon removal of the irrelevant items, the resulting three-item brief critical thinking scale was found to fit the ordinal Rasch model for the Danish sample as well as the Spanish sample separately. However, when analyzing the two country samples together, it was found that two items functioned differentially across countries, and thus cross-cultural invariance could only be achieved by splitting the person parameter estimates from the Rasch model (i.e. splitting for DIF; Hagquist et al., 2009) or equating the sum scores for DIF (Nielsen & Kreiner, 2024).
Previous research has not claimed that the brief critical thinking scale’s three-items cover all and detailed aspects of critical thinking. Rather that it covers the three aspects of critical thinking, which Nielsen et al. (2021) found to be common across three definitions of critical thinking (Facione, 1990; Halpern, 2003; Pintrich et al., 1991): the critical thinking aspects of how often the student questions things and decide about them, how the student decides about a theory, an interpretation or conclusion, and how the student looks for alternatives.
Previous validity studies (and other studies) have so far only used a course specific three-item scale (CTh) on samples of psychology students in various courses. Thus, there is currently a gap in the literature on the validity evidence for 1) it’s use with other university student groups, and for 2) a generalized (non-course specific) version of the scale.
1.1 The current study
In the current study, the aim is to conduct a broader validity study of a new non-course specific adaptation of the three-item critical thinking scale with a sample of university students from five different Bachelor’s degree programs belonging to five different academic faculties, while using the Rasch model for item analysis to ensure comparability to the previous studies. Thus, we will be testing whether the fit to the Rasch model extends to students from diverse disciplines with this more general version of the scale.
2. Methods
2.1 Data
The data in the current study stems from the prospective cohort study of admission testing, pre-academic exam self-efficacy and retention by O’Neill and Nielsen (2024), where critical thinking was measured as one of several possible predictors of drop out. The data were originally collected within the first two weeks of the first semester in the included Bachelor’s degree programs, through an in-class online survey after a brief introduction of the project to motivate students to complete the survey, which resulted in a response rate of 77.3%.
The data used for the current study was critical thinking data collected with the General Critical Thinking scale (see section 2.2) and background data from 584 students in five different academic programs belonging to different faculties in one Danish university. Table 1 shows the distribution of the current study sample on the five background variables included for analyses of differential item functioning and invariance in the present study (see analyses section). Additional details on the study sample are provided in O’Neill and Nielsen (2024).
Table 1.
Characteristics of the study sample (N = 584)
frequency | percentage | |
Degree programme (faculty) | ||
Medicine (Health Sciences) | 270 | 46.2 |
Law (Social Sciences) | 117 | 20.0 |
Biomedicine (Natural Sciences) | 87 | 14.9 |
History (Humanities) | 60 | 10.3 |
Robot technology (Technical Sciences) | 50 | 8.6 |
Admission track | ||
Grade-based admission | 365 | 62.5 |
Test-based admission | 219 | 37.5 |
Programme priority | ||
1st priority | 429 | 73.5 |
Not 1st priority | 155 | 26.5 |
Gender | ||
Female | 363 | 62.2 |
Male | 221 | 37.8 |
Age | Mean (SD) | range |
| 21.89 (2.69) | 18-44 |
2.2 Instrument
The General Critical Thinking (GCTh) scale used in the current study was a slightly adapted version of the CTh scale previously validated in both Danish and Spanish and found to fit the Rasch model (Nielsen et al., 2021; 2022). The adaptation was such that the scale was changed from measuring course specific CTh to general CTh. Thus, the only change to the items was a change of the reference “in this course” to a reference of “in my degree program”. The adaptations were done in collaboration with The Danish National Evaluation Institute. The GCTh items were rated according to how well they described the students in terms of frequency of the thinking, which was relayed in the items using a five-point response scale: 1 = never, 2 = rarely, 3 = sometimes, 4 = often, 5 = always.
Previous studies using the CTh scale reported reliabilities of 0.82 and 0.73 for Danish and Spanish psychology students taking courses in personality psychology and statistics, respectively (Nielsen et al. 2021), and 0.72 at baseline and 0.75 at one-year follow-up for Danish psychology students taking a statistics course (Nielsen et al., 2022). Reliability of the GCTh has not previously been reported. Table 2 shows the distribution of item responses, while Table 3 shows the raw score distribution of the GCTh prior to item analysis. The Danish items used in the current study are included in Table A1 in the Appendix.
Table 2.
Distribution of responses to the General Critical Thinking scale (N = 584)
n (%) | ||||||
items | Never (1) | Rarely (2) | Sometimes (3) | Often (4) | Always (5) | |
GCTh1: | I often find myself questioning things I hear or read in my degree program to decide if I find them convincing | 32 (4.0) | 157 (19.7) | 289 (36.3) | 106 (13.3) | 18 (2.3) |
GCTh2: | When a theory, interpretation or conclusion is presented in my degree program or in the readings, I try to decide if there is good supporting evidence | 26 (3.3) | 127 (16.0) | 259 (32.5) | 158 (19.8) | 31 (3.9) |
GCTh5: | Whenever I read or hear an assertion or conclusion in my degree program, I think about possible alternatives | 31 (3.9) | 178 (22.4) | 230 (28.9) | 130 (16.3) | 30 (3.8) |
Note. The numbering of items follows the original numbering of items in the MLSQ and other publications employing the original CTh scale to facilitate easy comparison.
Table 3.
Raw score distribution on the General Critical Thinking Scale (N = 584)
Raw score | n | % |
3 | 3 | 0.5 |
4 | 12 | 2.1 |
5 | 20 | 3.4 |
6 | 39 | 6.7 |
7 | 86 | 14.7 |
8 | 97 | 16.6 |
9 | 111 | 19.0 |
10 | 94 | 16.1 |
11 | 57 | 9.8 |
12 | 35 | 6.0 |
13 | 16 | 2.7 |
14 | 10 | 1.7 |
15 | 4 | 0.7 |
2.3 Item analysis by Rasch models
Item analyses were conducted to investigate the psychometric properties and validity of the GCTh scale in detail. Both unidimensional Item Response Theory (IRT) and Rasch models (RM; Rasch, 1960; Andersen, 1983) assume that items in a scale adhere to (Kreiner, 2013; Mesbah & Kreiner, 2013):
Unidimensionality: The items of a scale assess one single underlying latent construct. In this study, the items should only measure the single construct of general critical thinking. This was established from the content of items, and the absence of negative local dependence among items (Marais, 2023; see below).
Conditional independence of items (no local dependence; No LD): The response to a single item should be conditionally independent from the response to another item of the scale given the latent variable. In this study this means that responses to any one of the items in the scale should depend only on the level of general critical thinking, and not also on responses to the other items in the scale. This was tested for all item pairs.
Absence of differential item functioning (no DIF): Items and exogenous (i.e. background variables) should be conditionally independent given the latent variable. In this study this would entail that responses to any one item on the scale should only depend on the level of general critical thinking, and not also on subgroup membership (e.g. degree program, or gender). This was tested for each item and each exogenous variable.
Overall invariance: The entire set of items should function invariantly across subgroups (c.f. DIF, which was tested for a single item at a time).
In addition, RMs assume that item responses adhere to:
Overall homogeneity: The rank order of the item parameters (i.e. the item difficulties) should be the same across all persons regardless of their level on the latent variable. In this study, this means that the order of the three items should be the same in terms of difficulty no matter the level of general critical thinking, or put in another way, that the item requiring the least critical thinking to be endorsed and the item requiring the most should be the same for all students. Within the item analysis, homogeneity was tested for low and high scorers across the entire set of item parameters.
As items in the GCTh are ordinal polytomous items, we used the Rasch model for ordered polytomous data. This can be parameterized in different ways, which all provide the same results, and it is possible to go from one to another (Kreiner, 2013; Mesbah & Kreiner, 2013; Kreiner & Nielsen, 2023). The software package used (i.e. DIGRAM) uses the power series distribution for estimation, but presents for example. item parameters in Rasch’s original multiplicative form and as partial credit category thresholds and locations. As many readers are familiar with the Partial Credit Model (PCM; Masters, 1982), we include estimates of the partial credit thresholds and locations in the results.
2.3.1. Statistics
The RM is characterized by the sufficiency of the raw score for the person parameter estimates; A property adhering only to Rasch models. Therefore, the estimation of parameters and inference concerning the fit of items to the RM can be conditional. Conditional inference eliminates person parameters by using the conditional distributions of items that do not depend on the person parameters, and thus, conditional inference does not need assumptions concerning the distribution or sampling of persons (Kreiner, 2013; Rasch, 1961). All inference in DIGRAM is conditional and thus the person parameters are not used, when testing the model (Kreiner & Nielsen, 2013, 2023).
Item parameters were calculated using conditional maximum likelihood (CML) estimates, since these estimates are known to be consistent and do not require any assumptions on the distribution of the person parameters (cf. the above; Christensen, 2013; Kreiner, 2025; Kreiner & Nielsen, 2023). All tests used test the null hypothesis that item responses fit the Rasch model against different alternatives. Two overall tests of fit were conducted using Andersen’s conditional likelihood ratio test (CLR; Andersen, 1973; Kreiner & Christensen, 2013a): a test of global homogeneity by comparison of item parameters in low and high scoring groups defined to be as close to two equal-sized groups as possible, and a global test of no DIF across the entire set of items in the scale in relation to each background variable in turn, i.e., a test of overall invariance. Fit of the individual items to the RM was tested by conditional infit and outfit statistics (Christensen & Kreiner, 2013; Kreiner & Nielsen, 2023), and also by comparing the observed item-restscore correlations with the expected item-rest score correlations under the model (Christensen & Kreiner, 2013; Kreiner, 2011; Kreiner & Nielsen, 2023). Item-rest score correlations are correlations between and item and the score with the item excluded. Too strong item discrimination will result in an item-restscore correlation that is stronger than expected under the Rasch model, while too low item discrimination will result in the opposite (Christensen & Kreiner, 2013). Conditional independence of items (i.e. no local response dependence) and absence of DIF was tested using Kelderman’s likelihood-ratio test (Christensen & Kreiner, 2013; Kelderman, 1984; Kreiner & Christensen, 2013c).
DIF and invariance were tested in relation to five central background variables. Degree program (Medicine, Law, Biomedicine, History, Robot technology), Admission track (Grade-based admission, Test-based admission), Program priority (1st priority, not 1st priority), Gender (Female, Male), and Age groups (20 years and younger, 21 years, 22-25 years, 26 years and older).
Person fit was assessed with a two-step procedure. In the first step, the conditional probabilities of all response patterns for the different combinations of outcomes and exogenous variables are calculated. In the second step Martin-Löf’s exact test (Martin-Löf, 1977) is used to identify improbable response patterns. This test uses the conditional distribution of the response pattern given the total score as the test statistic, in the same way as Fisher’s exact test does in 2x2 tables. Conditioning with the sufficient score avoids using estimates of person parameters for the test of person fit (Kreiner & Nielsen, 2023, provides further explanations of the procedure, while Nielsen, 2024, provides another example of it’s use with scales fitting the dichotomous RM).
Once fit of the item responses to the Rasch model was established, person parameters were estimated and reliability and targeting were assessed. Person parameters were estimated using weighted maximum likelihood estimation, as these have been shown to be less biased than maximum likelihood estimates (Kreiner & Christensen, 2013b; Warm, 1989).
During analyses of reliability and targeting, we assumed that the distribution of the person parameter was normal, we estimated the mean and standard deviation of this distribution, and we used this distribution to assess reliability and targeting. To estimate the reliability, we generated simulated GCTh data on person parameters for 20,000 persons, calculated the expected true scores for all persons and generated two independent sets of item responses and person scores. Given this data, reliability can be estimated as it would be if the distribution of the person parameters had been normal. In the current study, we estimated reliability as the ratio of the variances of the expected and observed scores, and the Person Separation Index (PSI) as the measure of reliability for the theta scale.
Targeting was analyzed by comparing the best standard error of measurement (SEM) that the scale can provide to the average SEM in the study population. Since we are aware that measurement with a limited set of items is biased, we prefer to measure the so-called standard error of measurement by the RMSE(θ) instead of the SEM(θ). In addition, since we can define the exact RMSE as a function of θ, we can also find the person parameter where RMSE is minimized. We refer to this location as the target of the test, and refer to the test information and RMSE at this point as the target information and RMSE (Kreiner & Christensen, 2013b). Thus, the target of the test is the location on the q scale, where information is maximized and the RMSE is minimized. We assessed targeting by the two target indices (Kreiner & Christensen, 2013b): the target information index (the ratio between the average test information and the target information), and the target RMSE index (the ratio between the average RMSE and the RMSE at target). Both indices should have a value close to one. The target of the observed scores and the standard error of measurement of the observed scores were also calculated. Targeting was also illustrated graphically by plotting an item map showing the distribution of partial credit category threshold locations against the locations of the weighted maximum likelihood estimates of the person parameter, the person parameters for the population (assuming a normal distribution), and the test information function.
All the statistical tests used tested whether the data complied with the assumptions of the RM, with significant p-values providing evidence against the RM. Rather than applying a deterministic critical limit of 5%, p-values were evaluated as a continuous measure of evidence distinguishing between weak (p < 0.05), moderate (p < 0.01), and strong (p < 0.001) evidence against the model (Cox et al., 1977). The Benjamini-Hochberg procedure was applied to adjust the false discovery rate (FDR) taking multiple testing into account, when appropriate (Benjamini & Hochberg, 1995). All analyses were done using the Digram software package (Kreiner, 2003; Kreiner & Nielsen, 2013; 2023), while the item maps were created using R (R Core Team, 2021).
3. Results
The GCTh scale fitted the Rasch model for the total sample of 584 students in the five different degree programs belonging to five different faculties. There was no evidence against global homogeneity, and thus the scale functioned in the same way for low as well as high scorers (Table 4). There was no evidence against overall invariance, in the sense that the entire item set functioned in the same way across subgroups defined by degree programs, admission track, program priority on application, genders or age groups (Table 4). Nor was there any evidence against fit of the individual items to the Rasch model with any of the three tests used (Table 5).
Table 4.
Global tests of homogeneity and invariance for the final General Critical Thinking scale model (N = 577)
Tests of fit | CLR | df | p |
Global homogeneitya | 15.2 | 11 | 0.173 |
Invariance | |||
Degree program | 48.2 | 44 | 0.305 |
Admission mode | 12.0 | 11 | 0.361 |
Program priority | 14.0 | 11 | 0.234 |
Gender | 18.3 | 11 | 0.075 |
Age groups | 32.3 | 33 | 0.504 |
Notes. CLR = Conditional Likelihood Ratio test
a The test of homogeneity is a test of the hypothesis that item parameters are the same for persons with low or high GCTh scores.
Table 5.
Item fit statistics for the General Critical Thinking Scale (N = 577)
Item-restscore correlations | |||||||
items | outfit | p | infit | p | observed g | expected g | p |
GCTh1 | 1.011 | 0.845 | 1.010 | 0.859 | 0.57 | 0.55 | .570 |
GCTh2 | 0.976 | 0.669 | 0.983 | 0.769 | 0.55 | 0.55 | .960 |
GCTh5 | 1.011 | 0.841 | 1.008 | 0.891 | 0.56 | 0.55 | .860 |
Notes. g = Goodman & Kruskal’s gamma coefficient (Goodman & Kruskal, 1954).
Tests for differential item functioning (DIF) for single items in relation to the aforementioned background variables, did not reveal any evidence of DIF. Likewise, test of conditional local independence of the items did not reveal any evidence against this (Table A2 in the Appendix).
3.1. Person fit
There was no evidence against person fit beyond what could be expected, when assessed across the total sample (Table A3 in the Appendix shows the misfit frequency at each score level, while Table A4 in the Appendix shows it broken down on subgroups defined by each exogenous variable). The frequency of person misfit was 29 (5%), while the expected misfit frequency was 20 (3.4). The difference was very small and borderline insignificant (SD = 4.41, z = 1.9973, p = 0.0458). Thus, there was no basis for claiming significant (or relevant) misfit of persons, and thus we claim the Rasch model fits all persons.
3.2. Targeting and reliability
The target of the test only lies a little more than a half logit below the mean of the population, and the population averages of test information and RMSE are less than 5% below the target information and the RMSE. In our experience, this is extremely good targeting. The reason may be a standard deviation of the person parameter in this study population of
1.35. This together with an average RMSE equal to 0.84 explains the relatively low reliability of the GCTS.
The GCTS is perfectly targeted, but it does not provide precise person level measurement. The excellent targeting is also illustrated in the item map, which shows that items cover almost the entire range of persons, and that information is almost equally high along most of the scale (Figure A1 in the Appendix). Reliability of the raw sum score scale and the estimated latent scale (q) was identical (c.f. PSI and r in Table 6), and at a level just sufficient for early stages of predictive or construct validation research, e.g. at least 0.70 (Nunnally & Bernstein, 1994). Category thresholds, item difficulties and item targets are provided in Table A5 for the interested reader.
Table 6.
Targeting and reliability of the General Critical Thinking Scale (N = 584)
Person raw score | |||||||||||||
Target | population | population | |||||||||||
q | Target info | Target RMSE | Average q | SD | Average test info | Average RMSE | Target info index | Target RMSE index | PSI | target | mean | mean SEM | r |
-0.74 | 1.447 | 0.831 | -0.14 | 1.35 | 1.390 | 0.845 | 0.961 | 0.983 | 0.70 | 8.00 | 8.84 | 1.18 | 0.71 |
Notes. The target info index = the ratio between the average test information and the target information. The target RMSE index = the ratio between the average RMSE and the RMSE at target. PSI = Person Separation Index = the ratio between the variance of θ in the population and the variance of the estimates of θ. SEM = The standard error of measurement of the observed score. r = reliability estimated as the ratio between the variance of the expected true score and the observed mean score.
3.2.2. Conversion between sum scores and person parameter estimates
To allow conversion of the raw sum scores to the estimates of person parameters – and vice versa – and to allow use of the preferred scale, Table 7 includes the sum score, the person parameter estimates on the logit scale, and the person parameter estimates rescaled to the range of the sum score.
Table 7.
Conversion from summed scale scores to weighted maximum likelihood estimates of person parameters and rescaled person parameters for the General Critical Thinking Scale (N = 584)
General Critical Thinking Scale | ||
Sum score | Person parameter | Rescaled person parameter |
3.00 | -5.010 | 3.00 |
4.00 | -3.654 | 4.60 |
5.00 | -2.826 | 5.58 |
6.00 | -2.106 | 6.43 |
7.00 | -1.418 | 7.25 |
8.00 | -0.738 | 8.05 |
9.00 | -0.052 | 8.86 |
10.00 | 0.643 | 9.69 |
11.00 | 1.354 | 10.53 |
12.00 | 2.100 | 11.41 |
13.00 | 2.879 | 12.33 |
14.00 | 3.748 | 13.36 |
15.00 | 5.136 | 15.00 |
Notes. Sum scores are raw scores as they would be on the scale, not the version for Rasch analysis, where it would be rescored 0-12. Person parameters are weighted maximum likelihood (WML) estimates of the person parameters resulting from the Rasch model. Rescaled person parameters are the WML person parameters rescaled to the original range of the summed raw score.
4. Discussion
The results showed the GCTh items to fit a Rasch model, i.e. there were no issues with fit of single items, no evidence of local response dependence, no evidence of DIF, no evidence against invariance across subgroups or low and high scorers. These results are in accordance with validity studies of the CTh scale in the course-specific version for only psychology students (Nielsen et al., 2021; 2022). Furthermore, targeting of the GCTh scale to the study sample of students was excellent for the current student sample. Thus, targeting was better for the current diverse sample of students, than what has been reported previously for the CTh scale with both Danish and Spanish psychology students (Nielsen et al., 2021; 2022). Thus, the brief 3-item measure of general critical thinking is exemplary in the way it functions equally well across degree programs from five very different faculties, and the information provided by the Rasch scale. Even so, the precision of both the GCTh and the CTh scales does not warrant use for individual assessment, as the SEMs for the latent theta scale have been well above the standard limit for this purpose (SEM = 0.3) across all studies so far (Nielsen et al., 2021; 2022). The limit is often applied in computerized adaptive testing as the stop-criterion (Wainer & Dorans, 2000), most probably because a SEM of 0.3 would correspond to a reliability of 0.90 if the variance of theta is equal to 1. Reliability of the sum score also points to the appropriateness of using the scale for statistical purposes such as group comparisons, but not individual assessment (Hale, Astolfi, 2014; Well & Wollack, 2003). As the current study is the first validity study of the GCTh scale, and was intended for use as an independent variable in a prediction study (O’Neil & Nielsen, 2024), we found the results satisfactory for this purpose. However, we recognize that the reliability and standard error of measurement of the GCTh scale could be improved, and that the obvious way forward would be development of additional items.
Future research aimed at investigating the validity of the GCTh further would benefit from including students admitted to other degree programs or other institutions than the five included in the current study, as well as students at later time points in their degree program. In addition, studies on such measurement phenomena as longitudinal DIF, longitudinal response dependence and items parameter drift would be able to shed light on the stability of the measurement properties of the GCTh scale across time.
5. Conclusion
The GCTh scale is well-suited for measuring students’ general critical thinking at entry to university and across very different degree programs. Both the raw sum score and the person parameter estimates resulting from the Rasch model can be used interchangeably depending on the purpose of studies and the preference of researchers with regards to relaying results. However, the precision of the scale only warrants use for statistical purposes and with reasonably large samples, and not assessment at the individual level.
CRediT authorship contribution statement
Tine Nielsen: conceptualization, methodology, formal analysis, investigation, ressources, writing – original draft, writing – review & editing. Lotte Dyhrberg O’Neill: investigation, ressources, writing – original draft, writing – review & editing Writing – review & editing, Writing – original draft, project administration.
Funding
The authors received no specific funding for this work from any funding agencies.
Conflict of Interest
The authors declare no conflict of interest.
Data Availability Statements
The internal review board at the University of Southern Denmark granted legal permission to use data according to current European data protection (GDPR) laws (reference number 10.389). The researchers do not have permission to share data.
References
References
Andersen, E. B. (1973). A goodness of fit test for the Rasch model. Psychometrika, 38, 123–140. https://doi.org/10.1007/bf02291180
Andersen, E. B. (1983). A general latent structure model for contingency table data. In H. Wainer and S. Messick (Eds.). Principles of Modern Psychological Measurement. (pp. 117–139). Lawrence Earlbaum.
Benjamini, Y., & Hochberg, Y. (1995). Controlling the false discovery rate: A practical and powerful approach to multiple testing. Journal of the Royal Statistical Society: Series B (Methodological), 57, 289–300. https://doi.org/10.1111/j.2517-6161.1995.tb02031.x
Christensen, K. B. (2013). Estimation of item parameters. In K. B. Christensen, S. Kreiner, & M. Mesbah (Eds.), Rasch models in health (pp. 49–62). ISTE & Wiley. https://doi.org/10.1002/9781118574454.ch3
Christensen, K. B. & Kreiner, S. (2013). Item fit statistics. In K. B. Christensen, S. Kreiner, & M. Mesbah (Eds.), Rasch models in health (pp. 83–103). ISTE & Wiley. https://doi.org/10.1002/9781118574454.ch5
Cohen, J. (1988). Statistical power analysis for the behavioral sciences. Earlbaum Associates.
Cox, D. R., Spjøtvoll, E., Johansen, S., van Zwet, W. R., Bithell, J. F., Barndorff-Nielsen, O., et al. (1977). The role of significance tests [with discussion and reply]. Scandinavian Journal of Statistics, 4, 49–70.
Crede, M. & Phillips, L. A. (2011). A meta-analytic review of the motivated strategies for learning questionnaire. Learning and Individual Differences, 21, 337–346. https://doi.org/10.1016/j.lindif.2011.03.002
Duncan, T. G. & McKeachie, W. J. (2005). The making of the motivated strategies for learning questionnaire. Educational Psychologist, 40, 117–128. https://doi.org/10.1207/s15326985ep4002_6
Facione, P. (1990). Critical thinking: A statement of expert consensus for purposes of educational assessment and instruction. Research findings and recommendations. American Philosophical Association.
Facione, P. (1991). Using the California Thinking Skills Test in research. Evaluation and Assessment: California Academic Press.
Goodman, L. A., & Kruskal, W. H. (1954). Measures of association for cross classifications. Journal of the American Statistical Association, 49, 732–769. https://doi.org/10.2307/2281536
Hagquist, C., Bruce, M., & Gustavsson, J.P. (2009). Using the Rasch model in nursing research: an introduction and illustrative example. International Journal of Nursing Studies, 46(3), 380–93. https://doi.org/10.1016/j.ijnurstu.2008.10.007
Hale, C. D, & Astolfi, D. (2014). Measuring learning and performance: A primer (3rd Ed). Saint Leo University.
Halpern, D. F. (2003). Thought and knowledge: An introduction to critical thinking. Erlbaum.
Holland, D. F., Kraha, A., Zientek, L. R., Nimon, K., Fulmore, J. A., Johnson, U. Y. et al. (2018). Reliability generalization of the motivated strategies for learning questionnaire: A meta-analytic view of reliability estimates. SAGE Open, 8, 1–29. https://doi.org/10.1177/2158244018802334
Huber, C. R., & Kuncel, N. R. (2016). Does college teach critical thinking? A meta-analysis. Review of Educational Research, 86(2), 431–468. https://doi.org/10.3102/ 0034654315605917
Khan, S. I. (2017). Critical thinking in Higher Education Functional English Course. European Journal of Educational Research, 6, 59–67. https://doi.org/10.12973/eu-jer.6.1.59
Kelderman, H. (1984). Loglinear Rasch model tests. Psychometrika, 49, 223–245. https://doi.org/10.1007/bf02294174
Kreiner, S. (2003). Introduction to DIGRAM. Department of Biostatistics, University of Copenhagen.
Kreiner, S. (2011). A Note on Item–Restscore Association in Rasch Models. Applied Psychological Measurement, 35(7), 557–561. https://doi.org/10.1177/0146621611410227
Kreiner, S. (2013). The Rasch model for dichotomous items. In K. B. Christensen, S. Kreiner, & M. Mesbah (Eds.). Rasch models in Health. (pp. 5–26). ISTE and Wiley. https://doi.org/10.1002/9781118574454.ch1
Kreiner, S. (2025). On specific objectivity and measurement by Rasch models: A statistical viewpoint. Educational Methods & Psychometrics, 3, article 20. https://dx.doi.org/10.61186/emp.2024.7
Kreiner, S. & Christensen, K. B. (2013a). Overall tests of the Rasch model. In K. B. Christensen, S. Kreiner, & M. Mesbah (Eds.). Rasch models in health. (pp. 105–110). ISTE and Wiley https://doi.org/10.1002/9781118574454.ch6
Kreiner, S. & Christensen, K. B. (2013b). Person parameter estimation and measurement in Rasch models. In K. B. Christensen, S. Kreiner, & M. Mesbah (Eds.). Rasch models in health. (pp. 63–78). ISTE and Wiley https://doi.org/10.1002/9781118574454.ch4
Kreiner, S. & Christensen, K. B. (2013c). Two tests of local independence. In K. B. Christensen, S. Kreiner, & M. Mesbah (Eds.). Rasch models in health. (pp. 131–136). ISTE and Wiley https://doi.org/10.1002/9781118574454.ch8
Kreiner, S. & Nielsen, T. (2013). Item analysis in DIGRAM 3.04. Part I: Guided tours. Research report 2013/06. University of Copenhagen, Department of Public Health.
https://biostat.ku.dk/DIGRAM/Item%20analysis%20in%20DIGRAM%205-01%20-%20guided%20tours.pdf
Makransky, G., Havmose, P., Vang, M. L., Andersen, T. E., & Nielsen, T. (2017). The predictive validity of using admissions testing and multiple mini-interviews in undergraduate university admissions. Higher Education Research & Development, 36(5), 1003–1016. https://doi.org/10.1080/07294360.2016.1263832
Marias, I. (2013). Local dependence. In K. B. Christensen, S. Kreiner, & M. Mesbah (Eds.). Rasch models in health. (pp. 111–130). ISTE and Wiley https://doi.org/10.1002/9781118574454.ch7
Martin-Löf, P. (1977). Exact tests, confidence regions and estimates. Synthese, 36, 195–206.
Masters, G. (1982). A Rasch model for partial credit scoring. Psychometrika, 47(2), 149–174. https://doi.org/https://doi.org/10.1007/BF02296272
Mesbah, M. & Kreiner, S. (2013). The Rasch model for ordered polytomous items. In K. B. Christensen, S. Kreiner, & M. Mesbah (Eds.). Rasch models in Health. (pp. 27–42). ISTE and Wiley https://doi.org/10.1002/9781118574454.ch2
Nielsen, T. & Kreiner, S. (2024). DIF equating in Rasch models. Book of abstracts of The Nordic Education Research Association (NERA) conference, p. 553. https://sv-se.eu.invajo.com/events/getinvitationfile/eventId/813fac80-aea8-11ed-85b1-3b1d50885dc4/docId/e3ae9900-d570-11ee-b2b4-e15571e1b7a9
Nielsen, T., Martínez-García, I., & Alastor-García, E. (2021). Critical thinking of psychology students: A within- and cross-cultural study using Rasch models. Scandinavian Journal of Psychology, 62(3), 426–435. https://doi.org/10.1111/sjop.12714
Nielsen, T., Martinez-Garcia, I., & Alastor, E. (2022). Exploring first semester changes in domain-specific critical thinking. Frontiers in Education, 7: 884635. https://doi.org/10.3389/feduc.2022.884635
Nunnally, J. C. & Bernstein, I. H. (1994). Psychometric theory (3rd Ed.). McGraw-Hill.
O’Neill, L. D. & Nielsen, T. (2024). Admission testing, pre-academic exam self-efficacy, and retention. A prospective cohort study. Studies in Educational Evaluation, 83, 101383. https://doi.org/10.1016/j.stueduc.2024.101383
Petress, K. (2004). Critical thinking: An extended definition. Education, 124, 461–466.
Pintrich, P. R. R., Smith, D., Garcia, T., & McKeachie, W. (1991). A manual for the use of the motivated strategies for learning questionnaire (MSLQ). National Center for Research to Improve Postsecondary Teaching and Learning.
Rasch, G. (1960). Probabilistic models for some intelligence and attainment tests. Danish Institute for Educational Research.
Rasch, G. (1961). On general laws and the meaning of measurement in psychology. Proceedings of the fourth Berkeley symposium on mathematical statistics and probability IV. 321–344.
R Core Team (2021). R: A language and environment for statistical computing. R Foundation for Statistical Computing, Vienna, Austria. URL https://www.R-project.org/.
Staib, S. (2003). Teaching and measuring critical thinking. Journal of Nursing Education, 44, 498–508. https://doi.org/10.3928/0148-4834-20031101-08
Tabachnick, B. G., & Fidell, L. S. (2007). Using multivariate statistics. Pearson Education, Inc.
Watson, G. & Glaser, E. (1964). Critical thinking appraisal manual. Harcourt, Brace & World.
van der Zanden, P. J., Denessen, E., Cillessen, A. H., & Meijer, P. C. (2018). Domains and predictors of first-year student success: A systematic review. Educational research review, 23, 57–77. https://doi.org/10.1016/j.edurev.2018.01.001
Wainer, H. & Dorans, N.J. (2000). Computerized adaptive testing – A primer (2nd Ed.), Lawrence Earlbaum Associates, Inc.
Warm, T.A. (1989). Weighted likelihood estimation of ability in item response theory. Psychometrika, 54, 427-450.
Well, C. S. & Wollack, J. A. (2003). An instructor’s guide to understanding test reliability. Testing and Evaluation Services, University of Wisconsin.
Table A1.
Danish items used in the current study
Number | Item text |
GCTh1 | Jeg stiller tit spørgsmålstegn ved ting, jeg hører eller læser på uddannelsen, for at finde ud af, om jeg synes, de virker overbevisende. |
GCTh2 | Når en teori, en fortolkning eller en konklusion præsenteres på uddannelsen, forsøger jeg at afgøre, om den er velunderbygget. |
GCTh5 | Når jeg hører eller læser en påstand på uddannelsen, overvejer jeg alternative forklaringer. |
Response scale: Aldrig (1), Sjældent (2), Ind i mellem (3), Ofte (4), Altid (5) | |
Note. The numbering of items follows the original numbering of items in the MLSQ and other publications employing the CTh scale to facilitate easy comparison.
Table A2.
Conditional likelihood ratio tests of local independence and no differential item function
Tested terms | c2 | df | p |
Local independence | |||
GCTh1 & GCTh2 | 21.58 | 16 | .157 |
GCTh1 & GCTh5 | 27.49 | 16 | .036+ |
GCTh2 & GCTh5 | 20.48 | 16 | .199 |
No Differential item function | |||
GCTh2 & Degree program | 23.34 | 16 | .105 |
GCTh2 & Degree program | 9.18 | 16 | .906 |
GCTh2 & Degree program | 26.27 | 16 | .050 |
GCTh1 & Admission mode | 6.40 | 4 | .171 |
GCTh2 & Admission mode | 5.42 | 4 | .249 |
GCTh5 & Admission mode | 3.18 | 4 | .529 |
GCTh1 & Program priority | 8.24 | 4 | .083 |
GCTh2 & Program priority | 4.16 | 4 | .385 |
GCTh5 & Program priority | 2.62 | 4 | .624 |
GCTh1 & Gender | 6.25 | 4 | .181 |
GCTh2 & Gender | 6.54 | 4 | .162 |
GCTh5 & Gender | 4.42 | 4 | .353 |
GCTh1 & Age | 11.31 | 12 | .502 |
GCTh2 & Age | 7.23 | 12 | .842 |
GCTh5 & Age | 8.42 | 12 | .751 |
Note. + Benjamini-Hochberg correction for false discovery rate rejects at 0.00278 for 5% critical level.
Table A3.
Assessment of person fit for the total sample (N = 577a)
Score | frequency | Misfit frequency | Expected misfit frequency |
4 | 12 | 0 | 0.00 |
5 | 20 | 4 | 0.59 |
6 | 39 | 0 | 0.16 |
7 | 86 | 6 | 2.68 |
8 | 97 | 4 | 2.98 |
9 | 111 | 5 | 4.64 |
10 | 94 | 4 | 4.34 |
11 | 57 | 4 | 2.34 |
12 | 35 | 1 | 1.30 |
13 | 16 | 1 | 0.71 |
14 | 10 | 0 | 0.00 |
Total | 577 | 29 | 19.73 |
Note. The expected number of misfitting persons was 20(3,4%), while number of misfitting persons was 29 (5,0%); SD = 4.41, z = 1.9973, p = 0.0458. a. As misfit (or fit) cannot be assessed at the extremes (scores 3 and 15), these scores are therefore not included in the Table.
Table A4.
Person fit for subgroups within single exogenous variables (N = 577)
Subgroups | frequency | misfit frequency | Expected misfit frequency |
Degree programme (faculty) | |||
Medicine (Health Sciences) | 267 | 15 | 8.7 |
Law (Social Sciences) | 116 | 6 | 4.2 |
Biomedicine (Natural Sciences) | 86 | 3 | 3.1 |
History (Humanities) | 59 | 3 | 2.1 |
Robot technology (Technical Sciences) | 49 | 2 | 1.6 |
Admission track | |||
Grade-based admission | 361 | 17 | 12.3 |
Test-based admission | 216 | 12 | 7.4 |
Programme priority | |||
1st priority | 424 | 22 | 14.5 |
Not 1st priority | 153 | 7 | 5.2 |
Gender | |||
Female | 357 | 16 | 12.1 |
Male | 220 | 13 | 7.7 |
Age | |||
20 years and younger | 145 | 3 | 5.2 |
21 years | 202 | 13 | 6.7 |
22-25 years | 182 | 12 | 6.1 |
26 years and older | 48 | 1 | 1.8 |
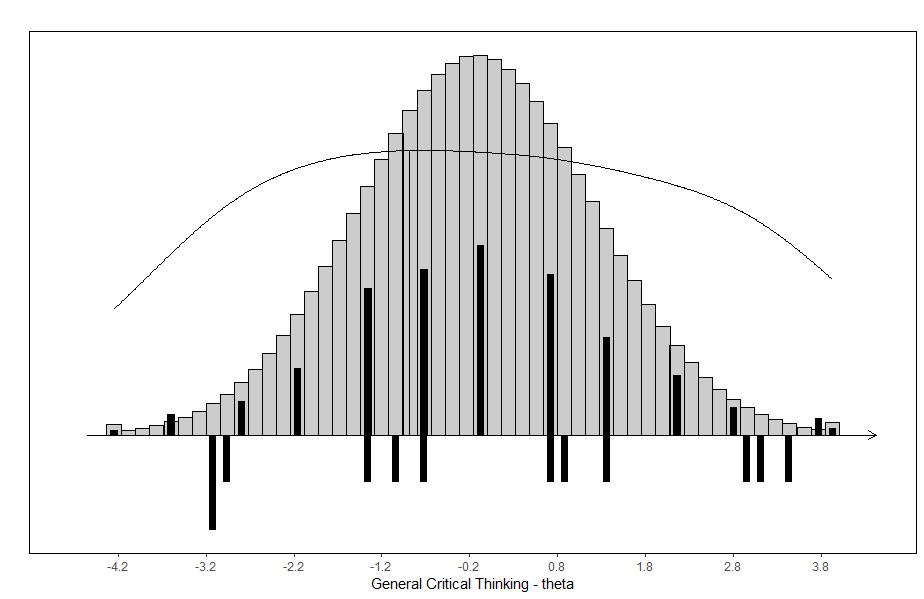
Figure A1.
Item map for the GCTh scale with distributions of person parameter locations and information curve above item threshold locations.
Notes: Person parameters are weighted maximum likelihood estimates, and they illustrate the distribution of the latter for the study sample (black bars above the line) and for the population under the assumption of normality (grey bars above the line).Also illustrated is the test information curve (above the line), relative to the distribution of the partial credit category thresholds (black bars below the line), while the threshold values are shown in Table A5 for reference). The vertical line from the information curve denotes the point of maximum information, i.e., the test target, while the test target value is provided in Table 6.
Table A5.
Partial Credit Thresholds, difficulty and target for conditionally independent items of the General Critical Thinking Scale (N = 577)
Thresholds | Midpoint | Item | Information | |||||
Items | 1 | 2 | 3 | 4 | Locationa | b | targetc | at target |
GCTh1 | -3.01 | -1.10 | 1.40 | 3.51 | 0.20 | 0.16 | -1.63 | 0.47 |
GCTh2 | -3.15 | -1.38 | 0.67 | 3.02 | -0.21 | -0.33 | -1.56 | 0.51 |
GCTh5 | -3.16 | -0.75 | 0.87 | 3.08 | 0.01 | 0.05 | 0.17 | 0.54 |
Notes.
a. Mean of the thresholds.
b. the person parameter where the expected score = max score/2.
c. the person parameter where item information is maximized.
