Full Html
Using the M-DIF Online Platform: A Practical Tutorial for DIF Magnitude Estimation
Full Html
- Introduction
Differential item functioning (DIF) refers to systematic differences in item performance between groups of examinees who possess comparable proficiency levels. Beyond considerations of fairness and equity, DIF analysis supports internal validity checks, cross-language comparisons, investigations of response processes, and the detection of measurement non-invariance (Zumbo, 2007). Consequently, DIF detection remains a critical component of assessment development and evaluation across education, psychology, and large-scale testing programs (Martinková et al., 2017).
Despite extensive methodological progress, the dominant DIF workflow, i.e., applying a single statistical detector, relying on significance testing, and classifying items as “DIF” or “non-DIF”, faces several well-documented challenges. First, definitions of DIF magnitude are inconsistent across methods (Karami et al., 2011; Huang & Ishii, 2025). Some procedures quantify group differences in item difficulty, others focus on probability gaps or curve-area metrics, and even within the same method family, commonly used thresholds differ. This inconsistency complicates cumulative interpretation and cross-study comparability. Second, binary significance testing is unstable and difficult to operationalize.
Correspondence should be made to Shan Huang, Graduate School of Education and Human Development, Nagoya University, Nagoya, Aichi, Japan. Email: huang.shan.t9@s.mail.nagoya-u.ac.jp
© 2026 The Authors .This is an open access article under the CC BY 4.0 license (https://creativecommons.org/licenses/by/4.0/)
p-values are highly sensitive to sample size, test length, and distributional assumptions; Type I error inflation is common and significance alone offers limited guidance about how much an item differs or whether revision is warranted (Berrío et al., 2020) . For real-world assessment practice, psychometricians increasingly require continuous, interpretable measures of DIF magnitude rather than dichotomous classifications.
To address these limitations, we introduce the Magnitude of Differential Item Functioning: An M-DIF Pretrained Model Approach (Huang & Ishii, 2025b), hereafter referred to as M-DIF. M-DIF defines DIF magnitude as the difference in item difficulty between focal and reference groups and integrates signals from multiple DIF detection methods together with key testing-condition indicators.
The M-DIF approach offers several advantages. First, it provides a single, continuous estimate of DIF magnitude by synthesizing diverse statistical detectors (e.g., likelihood ratio test (LR), Mantel–Haenszel method (MH), and item response theory–based indices (Swaminathan & Rogers, 1990; Roussos et al., 1999; Zumbo, 1999)) with contextual variables such as group sizes, test length (i.e., the number of items in the test), item characteristics, and difficulty distribution. Second, M-DIF separates estimation from decision-making: it outputs magnitude and uncertainty estimate while leaving cut-off selection to local policy or institutional standards. This flexibility avoids enforcing universal thresholds and supports applications in a variety of operational contexts. Third, by incorporating testing-condition indicators such as test length and sample size directly, M-DIF yields estimates that are naturally robust across heterogeneous assessment environments, reducing the burden on users to choose among competing methods.
Although M-DIF models can be directly accessed through R, users without programming experience may still find it difficult to install packages and execute model calls. To address this barrier, we released the M-DIF Shiny platform, which enables practitioners to obtain magnitude estimates without writing code or performing any technical setup. The purpose of this article is to provide a practical operating guide, and to demonstrate its use with real assessment datasets, from data preparation to result interpretation.
The remainder of this article is organized as follows. Section 2 presents the M-DIF platform, outlining its main features and the required input–output structure. Section 3 introduces the example dataset used throughout the tutorial. Section 4 details the step-by-step workflow for operating the platform, from uploading data to generating magnitude estimates and visualizations. Section 5 provides guidance on interpreting the M-DIF results, including patterns, graphical displays, and supporting diagnostic information. Section 6 concludes with a summary of key points and suggestions for practical use and future developments.
- Methods
Platform Core Functions
The M-DIF pretrained model has been implemented in an interactive Shiny web application to support users who may not be familiar with R programming. The platform requires no installation and can be accessed through any modern browser. Users only need to upload a properly formatted dataset, specify the focal and reference groups, and the system automatically estimates DIF magnitude and produces visual and tabular outputs. The platform is freely available at: https://huangshan.shinyapps.io/MDIF/.
The platform provides three main functions for practical DIF review.
(1) M-DIF magnitude estimation. For each item, the platform outputs the estimated magnitude of differential item functioning, which is defined as the predicted difference in item difficulty between focal and reference groups– along with an uncertainty interval. These results are presented in a sortable table that can be exported for reporting or further analysis.
(2) Visualization panels. The platform generates a magnitude plot that displays item-level effect sizes and confidence intervals, allowing users to quickly identify items with small, moderate, or large DIF. Visualization settings such as confidence level and DIF-threshold highlighting can be adjusted by the user.
(3) Additional diagnostic information. The interface also presents test-condition statistics (e.g., group sizes) and displays outputs from traditional DIF detection methods included in the dataset. These supplementary metrics serve as references to help users interpret magnitude estimates in relation to established procedures.
These core functions provide a complete workflow from data input to DIF interpretation. In the next section, we illustrate the use of the platform through a real dataset example, demonstrating data preparation, parameter settings, and result interpretation.
Data
The example dataset used in this tutorial is drawn from the Progress in International Reading Literacy Study (PIRLS) 2021 Cycle 5 assessment and contains responses from students in Hong Kong (HKG) and Germany (DEU) on the first booklet (IEA, 2023). The final column, Group, identifies each examinee’s country membership, with DEU serving as the reference group and HKG as the focal group.
A total of 473 students are included in this subset, with 170 from Germany and 303 from Hong Kong. All items are coded dichotomously (0/1) after scoring. The dataset comprises 25 dichotomously scored reading comprehension items drawn from two passages. In PIRLS 2021, Hong Kong administered the paper-based assessment, whereas Germany participated in the digital assessment. Accordingly, the same content-equivalent items carry different original PIRLS prefixes (RP for paper-based administration and RE for digital administration), reflecting the mode of delivery rather than differences in item content. Importantly, all items analyzed here are common items across the two administrations and are treated as the same items for DIF magnitude estimation. For presentation and analysis, items are labeled using a unified item identifier (e.g., RP41E01), which serves solely as an analysis label for content-equivalent common items across modes. The first passage consists of 15 items, and the second passage consists of 10 items. For illustration purposes, the second passage is treated as a set of previously validated items without DIF, whereas the first passage serves as the target set for DIF magnitude estimation in this tutorial. The example dataset used in this tutorial is available in the platform’s Help section for users to explore and replicate the analysis.
Analysis Procedure
Uploading the Data
To begin the analysis, the user uploads the dataset through the interface located at the upper-left section of the platform. On the Main tab, clicking the Browse… button under Upload CSV File opens a dialog for selecting the dataset. The platform currently supports CSV format only, and users should ensure their file is saved as a “.csv” before uploading. Once the file is selected, the system automatically imports the item responses, and the group variable required for M-DIF estimation. Figure A1 shows the data-upload panel of the M-DIF platform.
Basic Settings
After uploading the dataset, the user specifies several basic settings required for running the M-DIF analysis. These settings are provided in the left-hand panel under Basic Settings, as shown in Figure A2.
The Group Index Column indicates the column number in the dataset that contains the group identifier (DEU or HKG). The Focal Group and Reference Group fields allow users to explicitly define which group serves as the focal group and which serves as the reference group for DIF magnitude estimation.
The platform also requires users to specify an anchor-item range. The Anchor Start Column and Anchor End Column correspond to the column numbers of items assumed to be DIF-free and used to stabilize the estimation. In the example dataset, items from the second passage (columns 16 to 25) are treated as anchor items based on the assumption that they exhibit no DIF.
Optional Visualization Settings
Below the basic settings, the platform provides several optional visualization parameters that control how the M-DIF results are displayed. These settings do not affect the estimation itself but determine the appearance of the magnitude plot. As shown in Figure A3, the user may adjust the confidence level used to display uncertainty intervals, as well as thresholds for highlighting small and large DIF effects on the plot.
These thresholds can be tailored to the testing context. For example, in high stakes assessments, such as university entrance examinations, certification tests, or selection-based large-scale assessments, users may choose stricter thresholds (e.g., lower cutoffs for small and large DIF) to flag even modest discrepancies for closer inspection. In contrast, low stakes contexts, such as classroom assessments, formative evaluations, or psychological scales used for research purposes, may tolerate more variability, and thus users may adopt more lenient thresholds to avoid over-flagging items.
These threshold settings serve only as visual reference lines to support interpretation and do not influence the computed magnitude values.
Once the optional settings are configured, the analysis can be initiated by clicking the Run Analysis button.
- Results
DIF Magnitude Result
As shown in Figure 1, the DIF magnitude table appears on the right-hand side of the Main panel after the analysis is completed. The first column (Item Name) lists all target items selected for DIF evaluation. The Preds column reports the M-DIF magnitude estimates for each item. These values represent the predicted difference in item difficulty between the focal group (HKG) and the reference group (DEU). A positive value indicates that the item is estimated to be more difficult for the focal group, whereas a negative value indicates that the item is easier for the focal group. For example, RP41E01 shows a magnitude estimate of 0.01, suggesting almost no difference in difficulty between the two groups. In contrast, RP41E13 shows a magnitude of –0.85, indicating that the item is substantially easier for the focal group relative to the reference group.
The Lower Bound and Upper Bound columns present the uncertainty interval around each estimate, based on the confidence level specified in the visualization settings (e.g., 0.95). This interval reflects the range within which the true DIF magnitude is expected to fall with the chosen level of confidence. Narrow intervals indicate higher stability of estimation, whereas wider intervals suggest greater uncertainty.
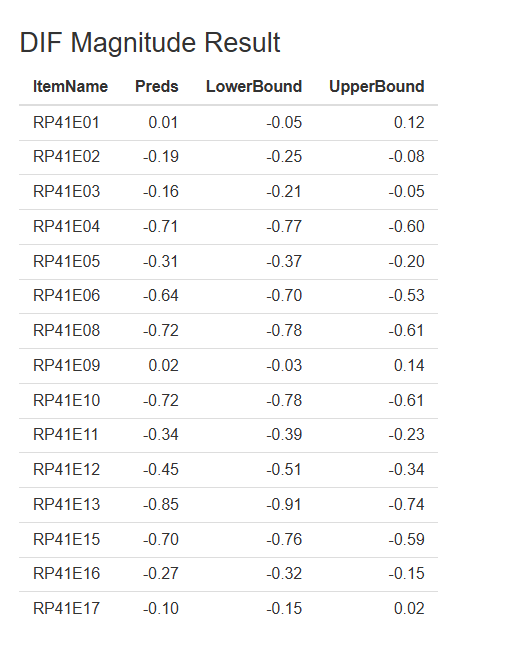
Figure 1. Example of DIF magnitude results.
Note. Item names (e.g., RP41E01) are unified analysis identifiers for content-equivalent common items across modes; original PIRLS prefixes (RP/RE) indicate delivery mode only.
Visualization Interpretation
Figure 2 presents a visual representation of the M-DIF magnitude estimates through a confidence‐interval plot. Each dot corresponds to the point estimate shown in the Preds column, and the horizontal line represents its confidence interval. Items positioned to the left of zero are easier for the focal group (HKG), whereas those to the right of zero are more difficult for the focal group relative to the reference group (DEU).
The vertical dashed lines in the visualization represent user-specified DIF magnitude thresholds and are intended as interpretive reference points rather than strict decision rules. Several conventions have been proposed in the literature for defining small, moderate, and large DIF. For example, the ETS (Educational Test Service) DIF classification framework suggests cutoffs of approximately 0.43 and 0.64 logits to distinguish negligible, moderate, and large DIF, with negligible DIF often considered ignorable in practice and moderate or larger DIF warranting further review (Zwick et al., 1999; Zwick, 2012). In addition to ETS-based criteria, simulation studies in the DIF literature have adopted alternative heuristic thresholds to distinguish small and large DIF effects. Common examples include cutoffs of 0.4 versus 0.8 logits (Hladká et al., 2024; Jiang, 2019), as well as 0.3 versus 0.5 logits (Zimbra, 2018; Lim et al., 2022), depending on the study context.
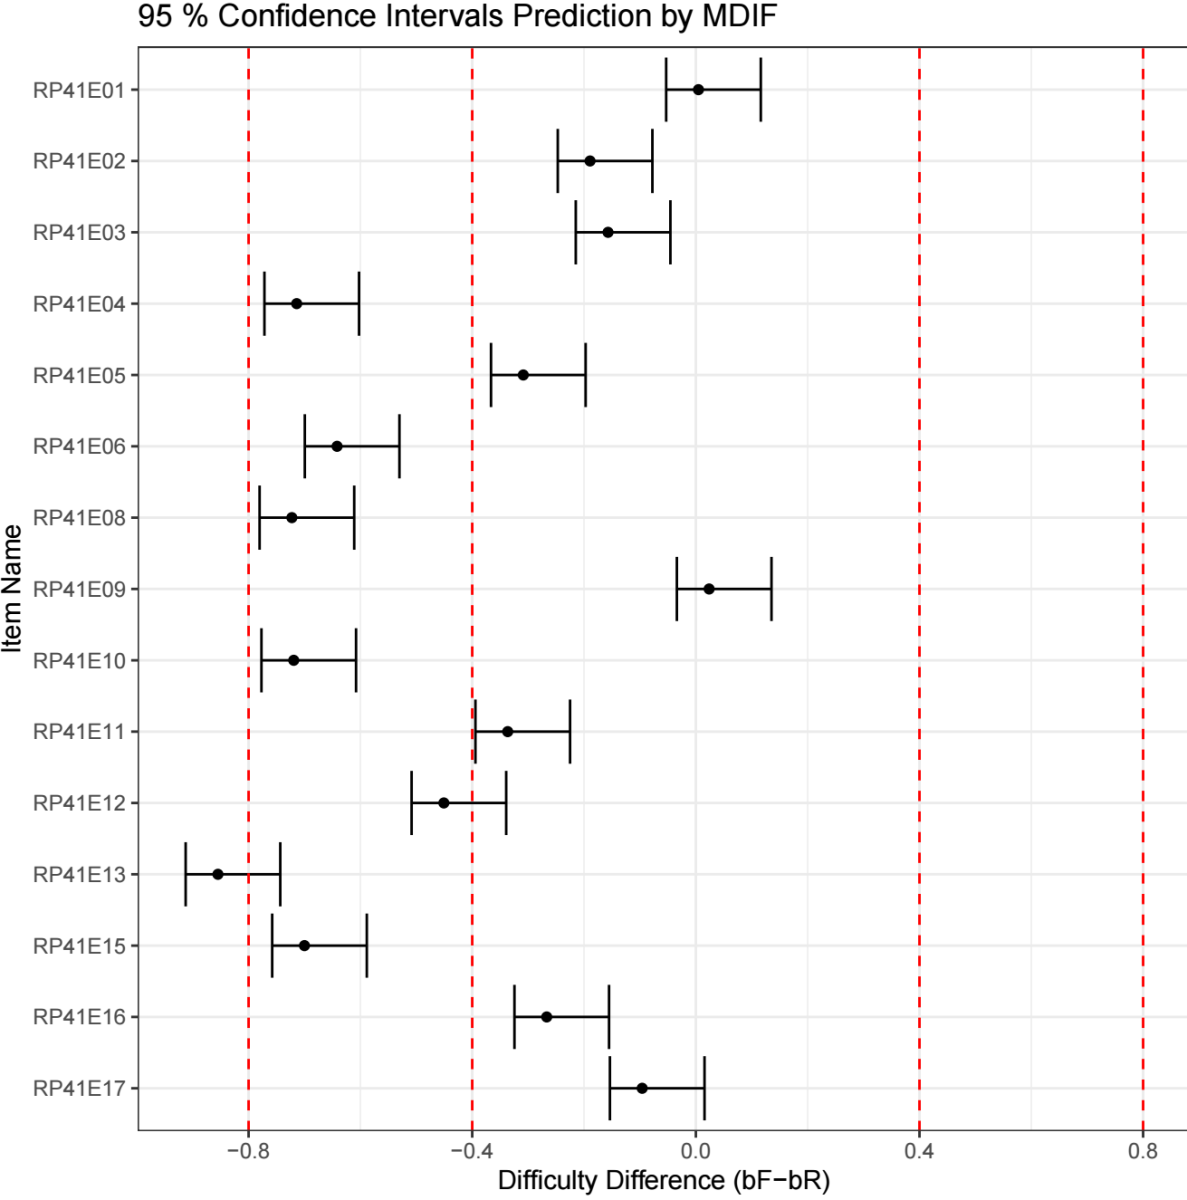
Figure 2. Visualization of DIF magnitude estimates with confidence intervals and threshold reference lines.
The choice of DIF thresholds should therefore depend on the study design and analytic purpose. More conservative thresholds are generally appropriate for high stakes testing contexts, where fairness decisions may have serious consequences. In contrast, low stakes or classroom-based assessments may justify more lenient thresholds that prioritize exploratory diagnosis and instructional feedback.
For illustration, Figure 2 displays DIF magnitude estimates using thresholds of 0.4 and 0.8 logits. Figure 2A reproduces the same results using ETS-recommended cutoffs (0.43 and 0.64 logits), whereas Figure 2B demonstrates a more lenient setting with thresholds of 0.3 and 0.5 logits. The corresponding visualization controls are shown in Figure A3 (Optional Visualization Settings).
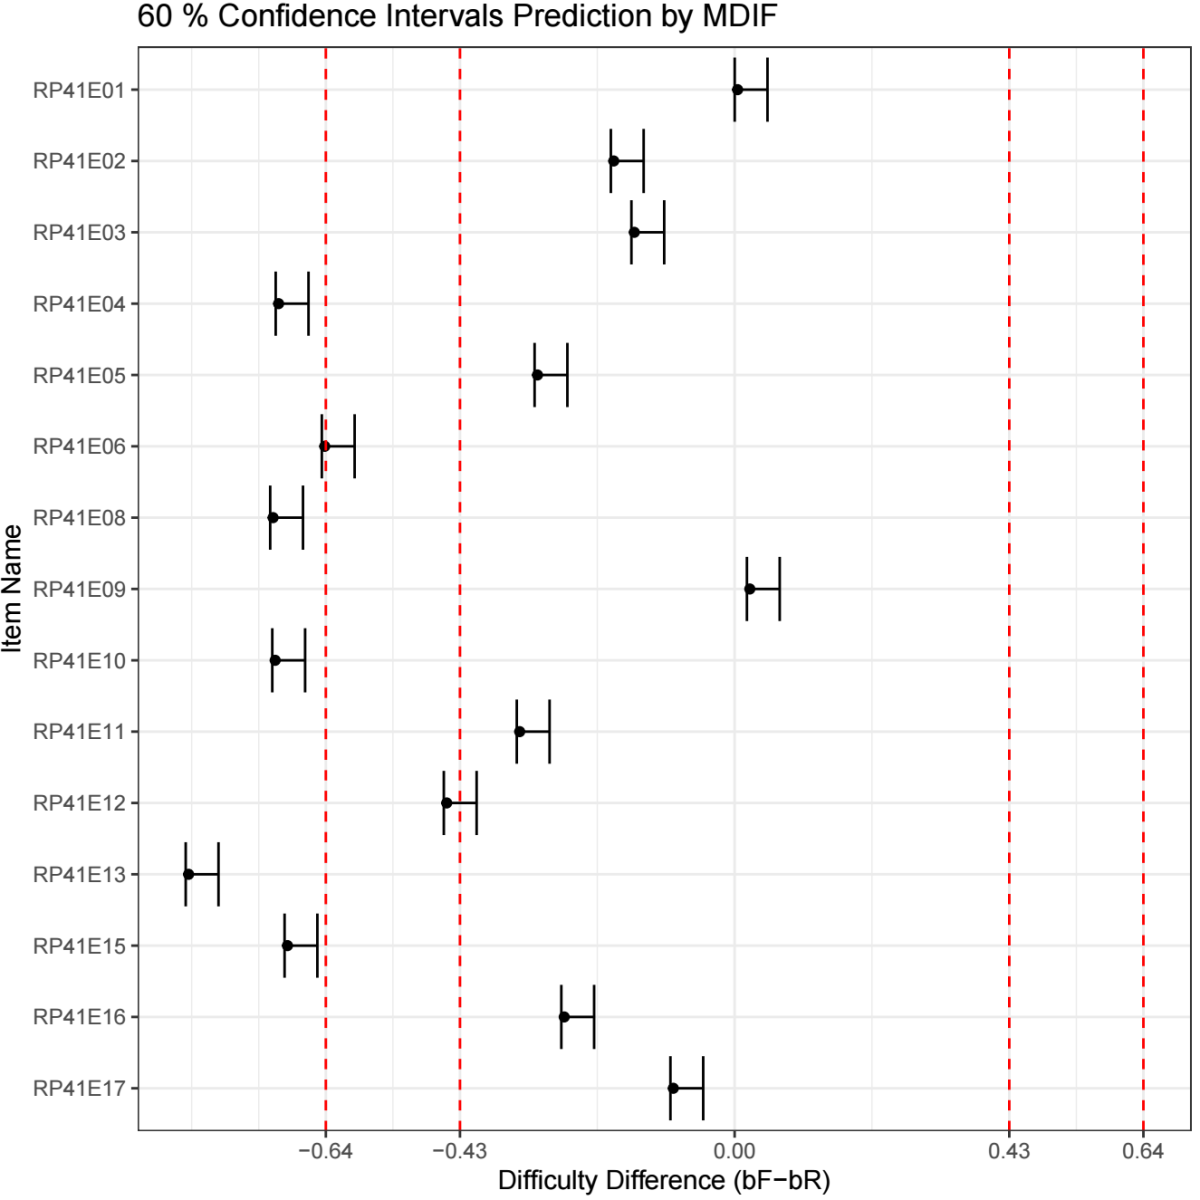
Figure 2A. Visualization using ETS-recommended DIF thresholds (0.43 and 0.64 logits) with 60% confidence intervals.
Note. DIF magnitude estimates are displayed using ETS-recommended thresholds (0.43 and 0.64 logits) for reference. Shaded regions indicate negligible, moderate, and large DIF categories. Confidence intervals correspond to the 60% level, illustrating a narrower representation of estimation uncertainty.
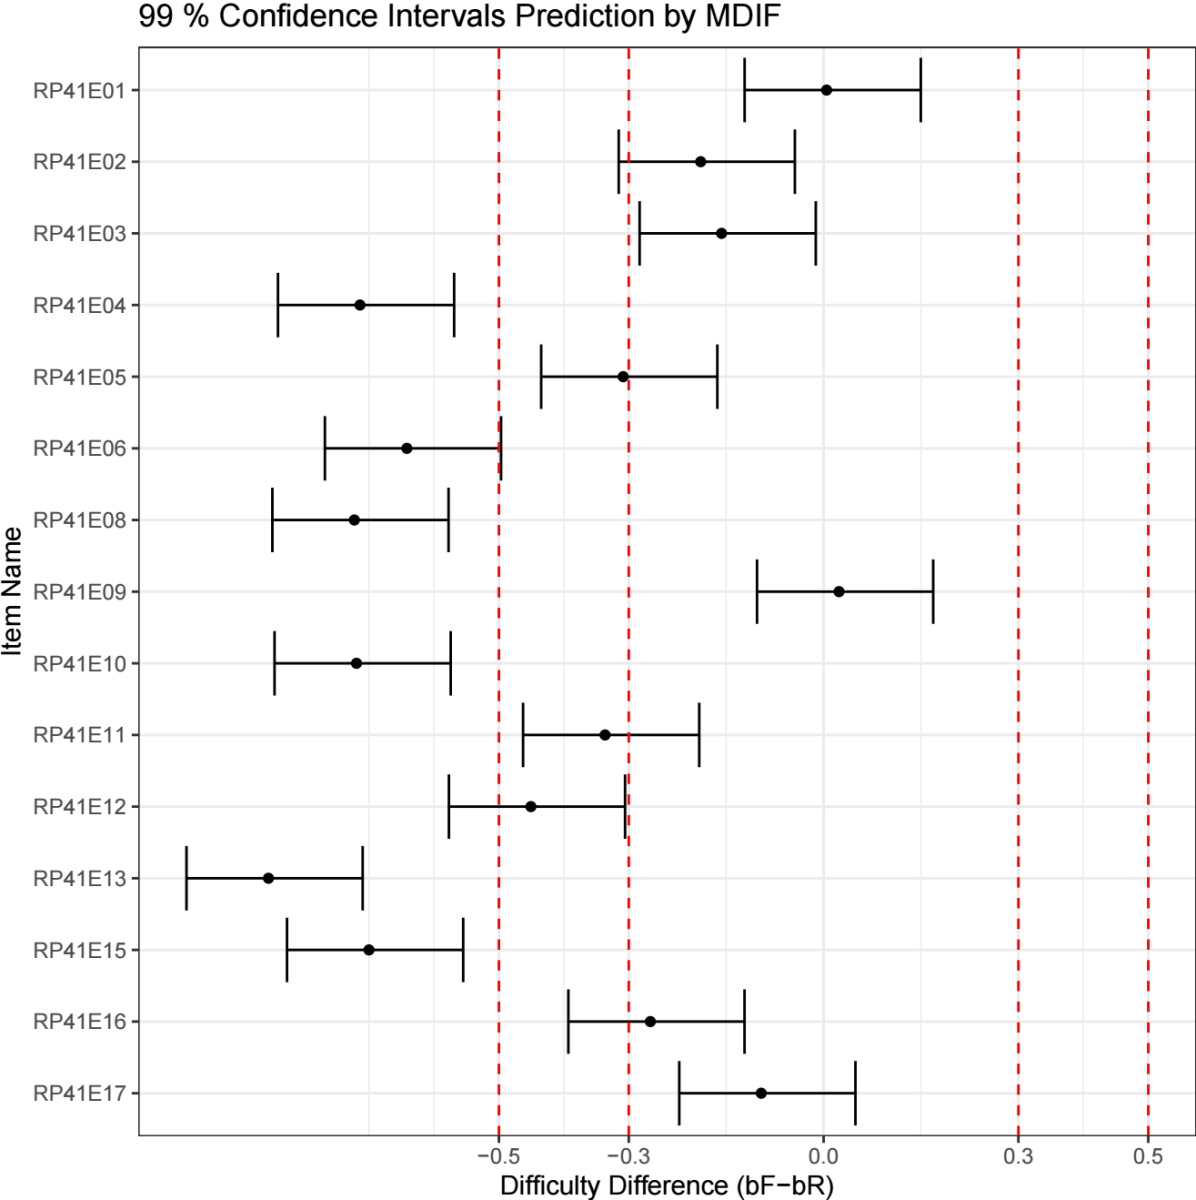
Figure 2B. Visualization using alternative heuristic DIF thresholds (0.3 and 0.5 logits) with 99% confidence intervals.
Note. DIF magnitude estimates are displayed using alternative heuristic thresholds (0.3 and 0.5 logits) to illustrate a more lenient threshold setting for exploratory interpretation. Confidence intervals correspond to the 99% level, yielding wider intervals and supporting more conservative statistical inference.
Beyond point estimates, the platform reports confidence intervals for DIF magnitude to convey estimation uncertainty. When an item’s confidence interval lies entirely beyond a specified threshold, the evidence for DIF can be regarded as stronger and more stable. In contrast, when a confidence interval overlaps a threshold, interpretation should be more cautious, as the estimated magnitude may fall on either side of the boundary due to sampling variability.
Unless otherwise specified, confidence intervals in Figure 2 correspond to the 95% level. As illustrated in Figure 2A, adopting a lower confidence level (e.g., 60%) produces narrower confidence intervals, yielding a less conservative summary of uncertainty. Conversely, using a higher confidence level (e.g., 99%), as shown in Figure 2B, results in wider confidence intervals and therefore supports more conservative statistical inference.
Overall, the visualization provides a concise summary of the direction, magnitude, and reliability of DIF effects across items, supporting transparent and flexible interpretation.
Additional Information and Statistics
In addition to the M-DIF magnitude estimates and visualization, the platform provides several supplementary tables under the Information and Statistics panel (see Appendix Figure A4). These tables offer contextual information that supports interpretation and allows users to compare M-DIF outputs with conventional DIF indicators.
The Test Information table summarizes basic testing conditions for each item, including sample sizes for the reference group (n.ref) and focal group (n.foc), as well as the total test length. These values help users assess whether the testing conditions may influence the stability of DIF estimation. For example, very small sample sizes or substantial imbalances between groups may lead to wider confidence intervals or less stable estimates.
The Item & Ability Information table presents additional item-level details, such as the estimated abilities for each group and the item difficulty parameters for the reference and focal groups. The final column shows the equated difference in item difficulty. This information provides a traditional IRT-based perspective and can be compared with the M-DIF magnitude estimates to examine consistency or identify items where different methods diverge.
The DIF Statistics table provides outputs from commonly used DIF detection methods, such as Mantel–Haenszel effect sizes, logistic regression statistics, and Lord’s chi-square. These metrics do not influence the M-DIF estimation directly but serve as complementary indicators for users who wish to cross-check results with familiar DIF procedures.
The platform also provides options to download the full set of results, including M-DIF magnitude estimates, the visualization plot and traditional DIF statistics, for documentation or further analysis (see Appendix Figure A5).
- Discussion
This tutorial introduced the M-DIF pretrained model and demonstrated its implementation through an online Shiny platform. By integrating outputs from multiple DIF detection procedures and test-condition indicators, M-DIF provides a unified, continuous estimate of DIF magnitude that is more interpretable and policy-flexible than significance testing-based approaches. The step-by-step example illustrates how practitioners can obtain magnitude estimates, visualize uncertainty, and triangulate results with traditional DIF statistics, all without requiring programming expertise.
Practical Implications
The platform is designed for operational and research contexts in which reviewers need transparent, magnitude-centered evidence to support item evaluation. Because M-DIF separates estimation from decision-making, institutions may adopt context-specific thresholds rather than relying on universal cutoffs, making the approach suitable for high stakes testing, international assessments, and routine DIF screening.
Limitations
Several limitations should be noted. First, the current release supports only dichotomously scored (0/1) items, and extensions to polytomous scoring models (e.g., partial‐credit or graded response) are planned for future. Second, the platform currently handles two-group DIF comparisons only; multi-group DIF and continuous covariate approaches remain outside the present scope. Third, although M-DIF integrates multi-detector information, the conceptualization of magnitude is grounded in Rasch-model difficulty differences. Applications to tests that violate Rasch assumptions or exhibit multidimensional structures should therefore be interpreted with caution.
Future Development
Future versions of the platform aim to expand functionality by supporting polytomous items, incorporating automated anchor selection, enabling multi-group DIF analysis, and providing batch processing. Additional research may also explore extending the pretrained model to 2PL/3PL or multidimensional IRT frameworks.
Funding and Conflict of Interest
The authors gratefully acknowledge the support of the JST SPRING Program (Grant Number JPMJSP2125). The authors would also like to express their sincere appreciation to the “THERS Make New Standards Program for the Next Generation Researchers” for providing valuable resources and academic support that facilitated the completion of this work. The authors declared no potential conflicts of interest with respect to the research, authorship, and/or publication of this article.
Data Availability Statement
This article is intended as a user-facing tutorial. The example dataset used in the tutorial is publicly available for download via the M-DIF online platform at https://huangshan.shinyapps.io/MDIF/
How to Cite
Huang, S., & Ishii, H. (2026). Using the M-DIF online platform: A practical tutorial for DIF magnitude estimation. Educational Methods & Psychometrics, 4: 23. https://dx.doi.org/10.61882/emp.2026.2
References
References
Berrío, Á. I., Gómez-Benito, J., & Arias-Patiño, E. M. (2020). Developments and trends in research on methods of detecting differential item functioning. Educational Research Review, 31: 100340. https://doi.org/10.1016/j.edurev.2020.100340
Berrío, Á. I., Herrera, A. N., & Gómez-Benito, J. (2019). Effect of sample size ratio and model misfit when using the difficulty parameter differences procedure to detect DIF. The Journal of Experimental Education, 87(3), 367–383. https://doi.org/10.1080/00220973.2018.1435502
Hladká, A., Martinková, P., & Magis, D. (2024). Combining item purification and multiple comparison adjustment methods in detection of differential item functioning. Multivariate Behavioral Research, 59(1), 46–61. https://doi.org/10.1080/00273171.2023.2205393
Huang, S., & Ishii, H. (2025a). A generalized multi-detector combination approach for differential item functioning detection. Applied Psychological Measurement, 49(3), 75–89. https://doi.org/10.1177/01466216241310602
Huang, S., & Ishii, H. (2025b). Enhancing precision in predicting magnitude of differential item functioning: An M-DIF pretrained model approach. Educational and Psychological Measurement, 85(2), 384–400. https://doi.org/10.1177/00131644241279882
International Association for the Evaluation of Educational Achievement. (2023). PIRLS 2021 international database (2nd Ed., including log-file data). IEA.
Jiang, J. (2019). Regularization methods for detecting differential item functioning (Doctoral dissertation). Boston College, Lynch School of Education.
Karami, H., & Salmani Nodoushan, M. A. (2011). Differential item functioning (DIF): Current problems and future directions. International Journal of Language Studies, 5(3), 133–142.
Lim, H., Choe, E., & Han, K. C. T. (2022). A residual-based differential item functioning detection framework in item response theory. Journal of Educational Measurement, 59, 1–25. https://doi.org/10.1111/jedm.12313
Martinková, P., Drabinová, A., Liaw, Y., Sanders, E. A., McFarland, J. L., & Price, R. M. (2017). Checking equity: Why differential item functioning analysis should be a routine part of developing conceptual assessments. CBE—Life Sciences Education, 16(2), rm2. https://doi.org/10.1187/cbe.16-10-0307
Roussos, L. A., Schnipke, D. L., & Pashley, P. J. (1999). A generalized formula for the Mantel–Haenszel differential item functioning parameter. Journal of Educational and Behavioral Statistics, 24(3), 293–322. https://doi.org/10.3102/10769986024003
Swaminathan, H., & Rogers, H. J. (1990). Detecting differential item functioning using logistic regression procedures. Journal of Educational Measurement, 27(4), 361–370. https://doi.org/10.1111/j.1745-3984.1990.tb00754.x
Zimbra, D. J. (2018). An examination of the MIMIC method for detecting DIF and comparison to the IRT likelihood ratio and Wald tests (Doctoral dissertation). University of Hawaiʻi at Mānoa.
Zumbo, B. D. (1999). A handbook on the theory and methods of differential item functioning (DIF). National Defense Headquarters.
Zumbo, B. D. (2007). Three generations of DIF analyses: Considering where it has been, where it is now, and where it is going. Language Assessment Quarterly, 4(2), 223–233. https://doi.org/10.1080/15434300701375832
Zwick, R. (2012). A review of ETS differential item functioning assessment procedures: Flagging rules, minimum sample size requirements, and criterion refinement. ETS Research Report Series, ETS RR-12-08. https://doi.org/10.1002/j.2333-8504.2012.tb02290.x
Zwick, R., Thayer, D. T., & Lewis, C. (1999). An empirical Bayes approach to Mantel–Haenszel DIF analysis. Journal of Educational Measurement, 36(1), 1–28. https://doi.org/10.1111/j.1745-3984.1999.tb00543.x
Manuscript Received: 28 NOV 2025
Final Version Received: 22 JAN 2026
Published Online Date: 01 FEB 2026
Appendix
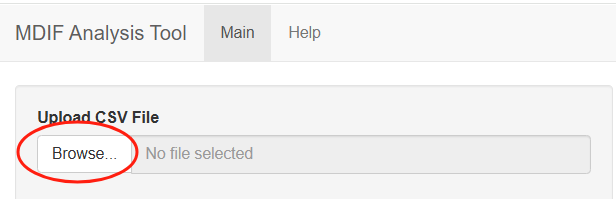
Figure. A1. Data upload interface.
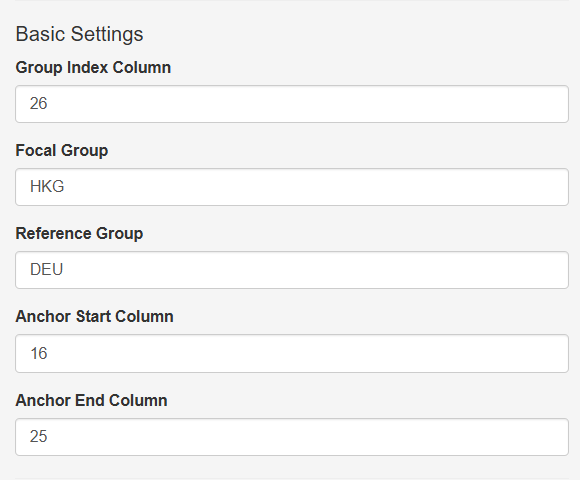
Figure A2. Basic Settings panel.
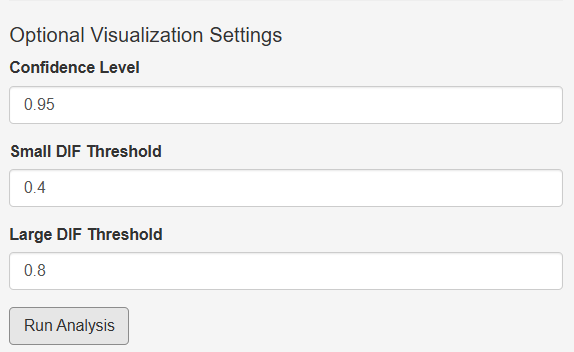
Figure A3. Optional visualization settings.
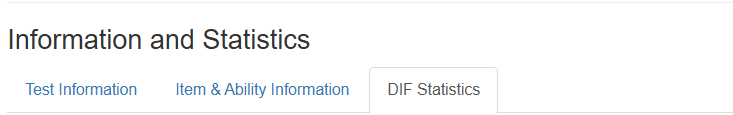
Figure A4. The Information and Statistics panel of the M-DIF platform, showing the three available tabs: Test Information, Item & Ability Information, and DIF Statistics.
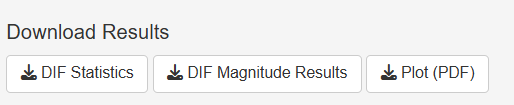
Figure. A5. Download options available in the M-DIF
