Full Html
Full Html
1. Introduction
Multiple-choice (MC) items are a widely used assessment tool in education and psychological testing. They typically consist of a stem, which poses a question or a problem, and a set of response options, including one correct answer, also known as the key response, and several incorrect but plausible alternatives, known as distractors. The popularity of MC items derives from their versatility, effectiveness and ease of scoring, making them ideal for large-scale testing and automated evaluation (Haladyna & Rodriguez, 2013).
Distractors are an integrated and essential element of MC items, with a direct impact on their effectiveness as assessment tools (Thissen et al., 1989). Gierl et al. (2017) summarized three key reasons why attention should be paid to distractor design: (i) all distractors must be plausible yet incorrect, making their design a time-consuming process; (ii) distractors influence
Correspondence should be made to Jeanette Melin, Department of Department of Leadership and Command & Control, Karlstad, Sweden. Email: jeanette.melin@fhs.se
© 2026 The Authors .This is an open access article under the CC BY 4.0 license (https://creativecommons.org/licenses/by/4.0/)
item quality and measurement outcomes, because test-takers must carefully evaluate response options to identify the correct answer; and (iii) analyzing distractors can provide valuable insights into why test taker errors occur, thereby supporting diagnostic inferences. Furthermore, recommendations for numbers of distractors vary. Gierl et al. (2017) suggest three to four distractors, whereas Rodriguez (1997) argues that two are sufficient, because it is difficult to produce more than two high quality distractors.
Typically, distractors vary in their ability to attract test takers. Examinees are unlikely to engage in blind guessing, but instead employ educated guessing, systematically eliminating the least plausible distractors (Rodriguez, 2005). Distractors that appeal most strongly to individuals who answer incorrectly are often referred to as strong distractors or most attractive distractors (Shin et al., 2020). The degree of attractiveness is thought to be related to the similarity between the distractor and the key response (Gierl et al., 2017). Guttman et al. (1967), showed that this similarity is determined by the number of key features shared by the distractor and the key response. This perspective offers a systematic approach to crafting effective distractors. Item developers can create plausible, effective distractors by firstly identifying the key features of the key response, and then systematically removing or altering one or more of these features.
The placement of the key response and distractors can significantly influence the response process, and this topic has generated various perspectives and insights. One area of focus is key balancing, which involves ensuring an equal distribution of key responses across all response options. However, more recent research advises against key balancing, instead advocating randomization of the position of key response (Lions et al., 2023). The rationale is that balanced keys can be exploited by test-wise examinees, increasing their chances of guessing correctly (Bar-Hillel & Attali, 2002). Nevertheless, randomization carries its own risks, such as overusing certain answer options. Carnegie (2017) explored sequences of key responses and found that while test takers might notice answer patterns and re-evaluate their choices, this did not adversely affect their performance.
Another focus area relates to the placement of the key response and the strongest distractor, and how this may affect the difficulty of an item. The phenomenon of edge aversion is test takers’ tendency to avoid response options at the edges, if they are unsure of the correct answer (Bar-Hillel & Attali, 2002). This leads to more difficult items, when key response(s) are at the edges. While the edge aversion phenomenon has been known for more than 20 years, more recent studies have identified a primacy effect (Hagenmüller, 2021; Hohensinn & Baghaei, 2017; Holzknecht et al., 2021; Lions et al., 2023; Schroeder et al., 2012) whereby, when the key response moves to the end of the set of options, the item difficulty increases. It has been proposed that, if the key response is early, test takers may not read all possible answers once they find an option they believe to be correct and will, therefore, be less likely to be distracted by any incorrect answers that follow (Schroeder et al., 2012). In addition, the distance between distractors and the key response has been studied. For instance, Shin et al. (2020) found that the proximity of the strongest distractor to the key response significantly impacts overall test difficulty; test takers perceived items as more challenging when the strongest distractor was placed close to the key response. Another example is given by Kiat et al. (2018), who reported that item accuracy decreased when the key response was positioned towards the end of the answer options, highlighting the influence of response order on test performance.
Previous research has emphasized the significance of both the quality and placement of distractors, and of the positioning of the key response. However, the findings in this area are sometimes contradictory and inconsistent, with varying conclusions on the impact of these factors. Given these complexities, this pilot study aims to explore how different placement of the key response and distractors may influence item difficulty. As part of the development process of two tests to measure logical ability to be included in the test battery of general mental ability for admission to Swedish basic military training, we conducted two preliminary data collections for this topic (one for each test). The two overarching research questions are: (i) how is the difficulty of an item affected by the placement of the key response (see specific hypotheses H1-H4 in Table 1) and (ii) how is the difficulty of an item affected by the placement of distractors in relation to the key response (see specific hypotheses H5-H6 in Table 1).
Table 1.
Two research questions with four and two hypotheses, respectively, and their justifications.
Overarching research questions | Hypotheses | Justification of hypothesis | |
How is the difficulty of an item affected by the placement of the key response? | H1 | Positioning the key response(s) at the edges increases the difficulty of the item. | Test takers tend to avoid response options at the edges if they are not completely sure (e.g. Attali & Bar-Hillel, 2003). |
H2 | Positioning the key response later in the order of response options increases the difficulty of the item. | Test takers are more likely to choose the first option presented, once they find an option they believe to be correct (e.g. Lions et al., 2023) | |
H3 | When two answers are required, positioning key responses in the incorrect order (i.e. presenting the second answer first) increases the difficulty of the item. | Logically, presenting the two key responses in the intended order aligns with logical cognitive processing and enhances comprehension. | |
H4 | When two answers are required, positioning the key responses further apart will increase the difficulty of the item. | Logically, positioning the key responses closer together allows for easier comparison and integration of information, reducing the cognitive load. | |
How is the difficulty of an item affected by the placement of the strongest distractor in relation to the key response? | H5 | Positioning the strongest distractor before the key response increases the difficulty of the item. | Positioning the strongest distractor before the key response is likely to divert test takers’ attention and interfere with the key response (e.g. Kiat et al., 2018). |
H6 | Increasing the distance between the key response and the strongest distractor decreases the difficulty of the item. | Test takers will find it more difficult to differentiate between the key response and the strongest distractor if they are placed close to one another (e.g. Shin et al., 2020). | |
2. Methods
Setting, data collection and sample
This work is part of the Swedish Defence Conscription and Assessment Agency’s work to update the existing Swedish Enlistment Battery (SEB). This is an overlapping activity for admission tests for both basic military training and basic police training. Both groups are
taking items under development. The project was approved by the Swedish Ethical Review Authority, ref. 2019-03576.
The admission tests for basic military training and basic police training are administered by the Swedish Defence Conscription and Assessment Agency. For basic military training, the admission tests are usually conducted around the age of 18 by those, male and female, who are obligated (by law) and by those who apply voluntarily (Jonsson et al., 2024). The tests include cognitive testing, assessment of psychological suitability by a psychologist, and physical examinations (Ludvigsson et al., 2022). The admission test for basic police training is open to anyone who meets the eligibility requirements (i.e. Swedish citizen, aged 18 years or older, a valid driving license for manual transmission, swimming proficiency, and high school grades or specific work experience). Testing includes psychological tests, physical and medical tests (Swedish Police Authority, n.d.).
All individuals called for admission tests received written information about their participation in a research study aiming to develop a new test to measure general mental ability. The on-site cognitive testing includes regular cognitive tests of 133 items with a maximum of 80 minutes (excluding instructions and example items; average working time approximately 48 minutes) for musters and 82 items with a maximum of 80 minutes (excluding instructions and example items; average working time 55 minutes) for police training. After these regular cognitive tests, the test takers were asked to complete additional items under development for the updated SEB. However, it was not explained to the test takers which items were the regular items, and which were under development.
For this study, data collection was conducted in 2024. For numerical series (NS), 1023 test takers took Sets A and B, and 609 test takers took Sets A and C (Figure 1). This gives a total sample for the NS tests of 1632 test takers. For the paper and fold (PFC), 564 test takers took Sets D and E, 576 test takers took Sets D and F, and 669 test takers took Sets D and G (Figure 1). This gives a total sample for the PFC tests of 1809 test takers. Table 2 shows test taker characteristics for each test and its sets of items. Within both NS and PFC, the proportions differed significantly by age group and selection group (p < 0.001), but not by sex (NS: p = 0.304; PFC: p = 0.603).
|
Figure 1. The common item design and number of test takers for the NS (left) and PFC (right) |
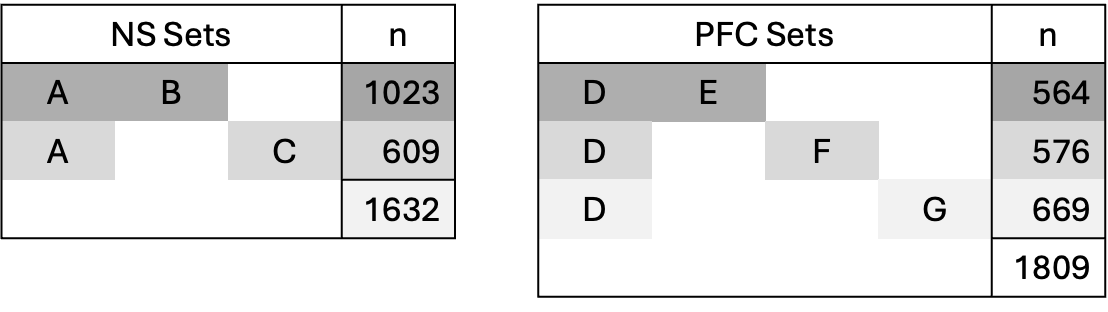
Table 2.
Test taker characteristics for NS and PFC, respectively, for each sets.
NS | PFC | ||||
Set A + B | Set A + C | Set D + E | Set D + F | Set D + G | |
n | 1 023 | 609 | 564 | 576 | 669 |
Sex | |||||
male | 723 (71 %) | 423 (69 %) | 377 (67 %) | 403 (70 %) | 472 (71 %) |
female | 300 (29 %) | 186 (31 %) | 187 (33 %) | 170 (30 %) | 197 (29 %) |
Age | |||||
17-19 years | 750 (73 %) | 524 (86 %) | 476 (84 %) | 531 (92 %) | 587 (88 %) |
>20 years | 273 (27 %) | 85 (14 %) | 88 (16 %) | 42 (8 %) | 82 (12 %) |
Selection group | |||||
musters * | 673 (66 %) | 492 (81 %) | 451 (80 %) | 504 (88 %) | 564 (84 %) |
volunteers ** | 147 (14 %) | 40 (7 %) | 34 (6 %) | 41 (7 %) | 42 (6 %) |
police | 203 (20 %) | 77 (13 %) | 79 (14 %) | 28 (5 %) | 63 (9 %) |
* test takers subject to military conscription for the admission tests for basic military training
** test takers voluntarily applying for the admission tests for basic military training
Tests
Numerical series (NS)
Tests with NS are typically used to measure logical abilities and are common in many batteries of tests of intelligence or general cognitive abilities (c.f., Salgado, 2017). In a NS item, the first four numbers in a series, such as “2 – 4 – 6 – 8”, are presented and the test taker is asked to select two response options out of five that will complete the sequence, i.e. 10 and 12 in this case.
Two parallel NS tests, Sets A and B, that are under development comprise 16 items each. The items’ development has been based on an item model approach, where it is assumed that an item comprises two key components: item radicals and surface characteristics (Irvine et al., 1990). Item radicals are the structural elements of an item defining its difficulty, while the surface characteristics are more superficial elements of the item, which can be changed without affecting the difficulty. The model items stem from a pool of existing NS items in the SEB and items recently developed and field-tested. A selection of model items was based on varying difficulties and logical rules. Thus, the items in Sets A and B are not identical to the model item or each other but should be within the same difficulty range as the model item.
A further set, C, was created by changing the positions of response options in Set B. This means that, when compared to Set A, Set C includes changes in both item radicals (i.e. position of response options) and surface characteristics. Table 3 shows the number of key responses at the edges, the distance between key responses, and whether key responses are ordered or not. Thus, for H1, for comparisons between Sets B and C, eight items with differences in the number of key responses at the edges were used; for H3, five items with different distances between key responses were used; and for H4, 11 items either ordered or unordered were used.
Table 3.
Number of key responses at the edges, distance between key responses and order of key responses in the NS items in Sets B and C, respectively.
Set B | Set C | |||||
Item | Edges | Distance | Ordered / unordered | Edges | Distance | Ordered / unordered |
1 | 0 | 1 | Ordered | 1 | 1 | Ordered |
2 | 1 | 2 | Ordered | 1 | 2 | Ordered |
3 | 1 | 3 | Ordered | 1 | 3 | Ordered |
4 | 1 | 2 | Ordered | 1 | 3 | Ordered |
5 | 0 | 1 | Ordered | 2 | 4 | Unordered |
6 | 1 | 3 | Ordered | 1 | 3 | Unordered |
7 | 2 | 4 | Ordered | 0 | 1 | Unordered |
8 | 1 | 1 | Unordered | 1 | 1 | Ordered |
9 | 0 | 1 | Unordered | 2 | 4 | Ordered |
10 | 1 | 2 | Ordered | 0 | 2 | Unordered |
11 | 1 | 1 | Ordered | 1 | 1 | Unordered |
12 | 1 | 1 | Unordered | 2 | 4 | Ordered |
13 | 1 | 2 | Unordered | 0 | 2 | Ordered |
14 | 2 | 4 | Unordered | 0 | 1 | Ordered |
15 | 1 | 3 | Unordered | 1 | 3 | Unordered |
16 | 1 | 3 | Ordered | 0 | 1 | Unordered |
Paper fold and cut (PFC)
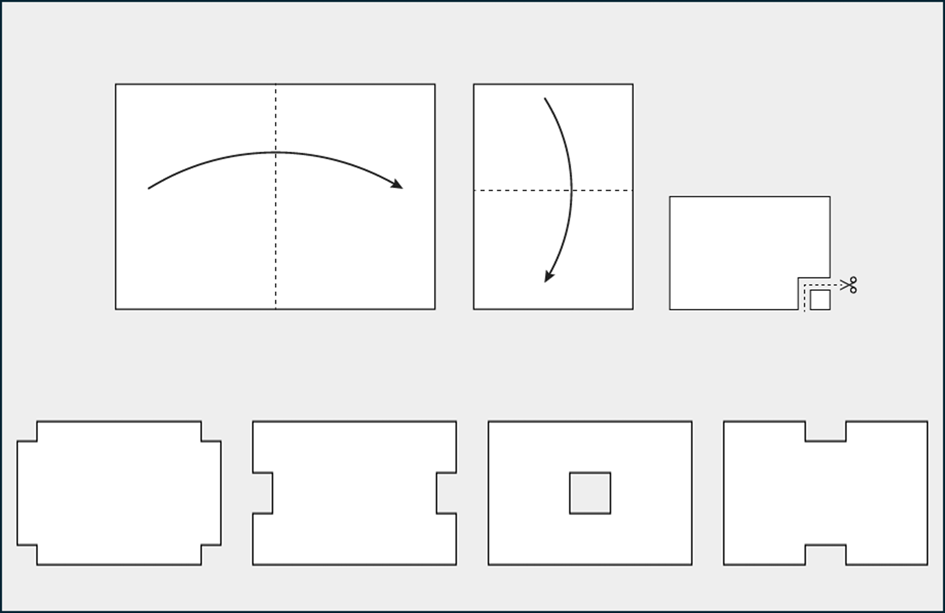
A PFC test can be considered a test for measuring logical ability (Wahlkrantz & Melin, 2025), although it also likely includes visualization skills, because similar tests are reported to do so (French et al., 1963; Garcia-Segarra et al., 2024). A PFC item comprises an illustration of a folding and cutting sequence and four response options showing unfolded pieces of paper with different shapes from possible cuts (Figure 2). The test taker is asked to choose the response option that corresponds to the unfolded form resulting from the folding and cutting sequence.
|
Figure 2. The figure depicts a simplified version of a PFC item for illustrative purposes. The upper portion of the figure is the main picture, and below are the four response options. The response option on the far left (1) is the key response; the others are distractors. |
For this study, as part of the ongoing development of parallel versions of PFC tests (Wahlkrantz & Melin, 2025), five items from the original 14-item PFC test were handpicked for Set D. They were selected to achieve variations in difficulty, number of folds and cuts, and for an appropriate fit to the Rasch model, and because they contribute to anchoring the three experimental sets in this study.
Six newly generated PFC items were created to form Set E. These were also expected to have variations in task difficulty (due to the number of folds and cuts [Wahlkrantz & Melin, 2025]), and the distractors were designed using different strategies: two items with a “rotation strategy”, two items with a “moving/removing cut(s) strategy” and two items with a “changings shape(s) of cut(s) strategy”. Furthermore, the strongest distractor was defined a priori based on what the authors considered to be most visually similar to the key response. The key response and distractors in Set B items were randomly positioned. The distractor positions in Set E items were then modified in two different ways to form Sets F and G. In three Set F items, the strongest distractor was placed next to, and before the key response options, and in three other items, the strongest distractor was placed next to, and after the key response. In three Set G items, the strongest distractor was placed two or three steps before the key response options, and in three other items, the strongest distractor was placed two or three steps after the key response. Details of items in Sets E-G are shown in Table 4.
Table 4.
Item characteristics and response options order for PFC Sets E, F and G.
Item | No. Folds | No. Cuts | Distractor strategy | Set E response options order | Set F response options order | Set G response options order |
1 | 2 | 3 | Rotation | y – x – S – K | S – K – x – y | S – x – y – K |
2 | 3 | 3 | Rotation | S – x – y – K | x – y – K – S | K – x – S – y |
3 | 3 | 2 | Moving/removing/ | x – K – y – S | x – y – K – S | K – x – y – S |
4 | 2 | 5 | Moving/removing/ | S – y – x – K | x – S – K – y | S – x – y – K |
5 | 2 | 3 | Changing shape(s) and/or moving and/or adding cut(s) | x – y – K – S | x – y – S – K | S – x – K – y |
6 | 3 | 3 | Changing shape(s) and/or moving and/or adding cut(s) | S – K – y – x | x – K – S – y | x – K – y – S |
K = key response, S = strongest distractor
Data analysis
Descriptive analyses of the proportion of each response option were performed in IBM SPSS Statistics 26. Thanks to the common item design (all NS test takers took Sets A and B or Sets A and C; all PFC test takers took Set D and one of Sets E, F or G), items were organized into matrices for the analyses (Figure 1). Subsequently, they were entered into the Rasch Unidimensional Measurement Model 2030+ (RUMM) software (Andrich et al 2012). Typical model-fit and invariances analyses were performed (c.f., Hobart & Cano, 2009; Tennant & Conaghan, 2007), including assessments of item-fit residuals, chi-squared statistic, residual correlation, and differential item functioning (DIF). This was followed by a comparison of estimates of the difficulties of items – scaled on a joint logit scale, anchored through the Set A items for NS and the Set D items for PFC – to answer the hypotheses H1-H6 below. For the NS, the corresponding items in Sets B and C were compared, and for the PCF, the corresponding items in Sets E, F and G were compared, all in terms of absolute values and using t-tests.
H1: Task difficulty was compared between NS Sets B and C (eight items), PFC Sets E and F (four items) and PFC Sets F and G (five items), where one or two key responses were placed at the ends. This tests whether positioning key responses at the edges increases item difficulty, as test takers may avoid outlying options unless certain.
H2: Task difficulty was compared between PFC Sets E and F (five items) and PFC Sets F and G (five items), where the key responses had different positions. This examines whether test takers tend to select earlier options, making later key responses more difficult to identify.
H3: Task difficulty was compared between NS Sets B and C (11 items), where the order of key responses differed. This tests whether presenting key responses in an unnatural order (i.e., the second answer first) increases the difficulty.
H4: Task difficulty was compared between NS Sets B and C (six items), where the distance between key responses varied. This investigates whether greater spacing between key responses makes comparison and integration more challenging.
H5: Task difficulty was compared between PFC Sets E and F (four items). This tests whether an early strong distractor misleads test takers and increases difficulty.
H6: Task difficulty was compared between PFC Sets F and G (all six items), where the distance between the key response and the strong distractor differed. This examines whether increasing this distance makes it easier to distinguish the key response from the distractor.
The items that can be compared are based on the information available in Tables 3 and 4 and are summarized, with the results, in Tables 6 and 7.
3. Results
The results begin with summaries of the Rasch analyses of NS and PFC, respectively. Then the hypotheses are addressed one by one.
Numerical series (NS)
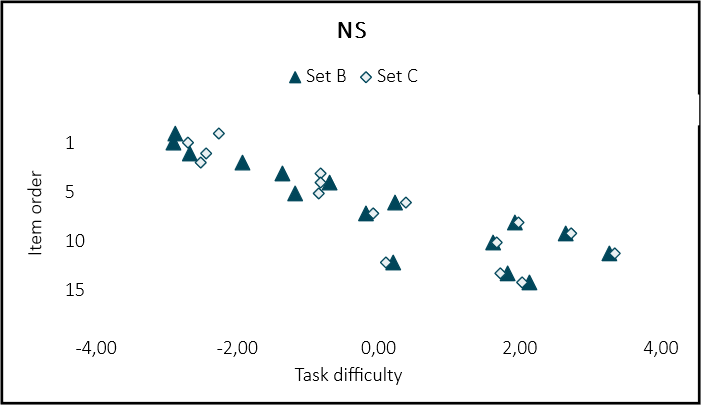
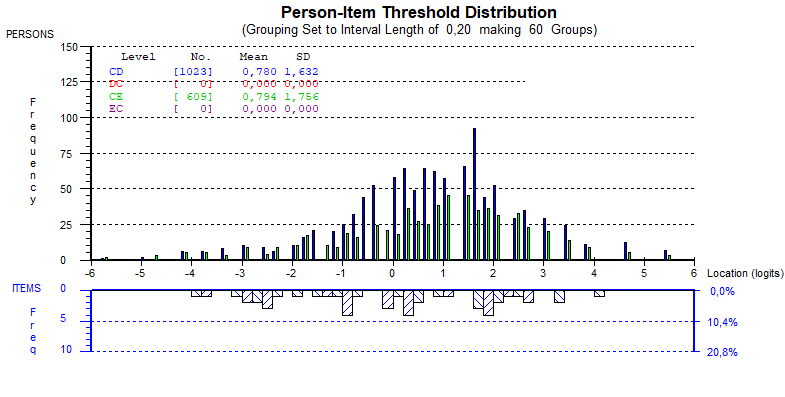
In the Rasch analysis, of all 48 NS items, several displayed misfit in terms of fit residuals > 2.5 (n=11) or < -2.5 (n=7) or Chi2 (n=9). On closer inspection of the distractor curves and item characteristic curves, the misfit was not considered to be severe. There was no DIF, but some correlations of item fit residuals indicated local dependency (particularly for corresponding items in Set A). Despite these issues, it was not deemed to significantly affect the estimates of task difficulty; therefore, all items were scaled on a joint logit scale, anchored through Set A items, which are shown in Figure 2. The distribution of estimated task difficulties was approximately equal; Set B ranged from -2.900 to 3.256 logits and Set C ranged from -2.699 to 3.342. Moreover, the test takers’ abilities were 0.780 logits (SD 1.632) for test takers who took Set A and B, and 0.794 logits (SD1.756) test takers who took Set A and C (Appendix 1). There were no statistically significant differences in the test takers’ estimated abilities, based on the anchor items, Set A, between those who took Set A and B or Set A and C (p=0.992).
|
Figure 2. Estimated task difficulties for the NS items in Set B (dark blue triangles) and Set C (light blue diamonds) on a joint logits scale on the x-axis. For all cases except items 4 and 5, the measurement uncertainties (i.e. two times standard error, ~ 95% confidence intervals) of task difficulty estimates overlap, but are not shown in the figure to make it readable. |
Paper fold and cut (PFC)
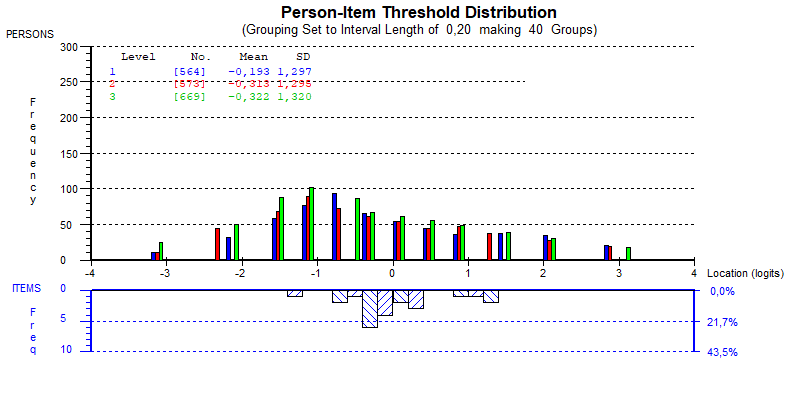
The Rasch analysis of all 22 PFC items revealed three items with fit residuals slightly outside +/- 2.5 (A3 -2.78, B6 2.71 and C6 2.65) and one of them also showed significant Chi2 (A3 <0.001), but no LD or DIF. Those minor deviations were considered acceptable to scale all items together on a joint logit scale, anchored through Set D items, which is shown in Figure 3. The distribution of task difficulty estimates across Set E, F and G vary slightly, particularly item 4 in Set F was approximately 0.5 logits easier than any other items. The test takers abilities were slightly below 0.00 logits for all groups when estimated on the joint logit scale (Appendix 1) and there were no statistically significant differences between the test takers estimated abilities based on the anchor items, Set D (p=0.325).
|
Figure 3. Estimated task difficulties for the items in Sets E (dark blue triangles), F (mid-blue circles) and G (light blue diamonds) on a joint logit scale on the x-axis. For all cases except items F5 and F5, the measurement uncertainties (i.e. two times standard error, ~ 95% confidence intervals) of task difficulty estimates overlap, but are not shown in the figure to make it readable. |
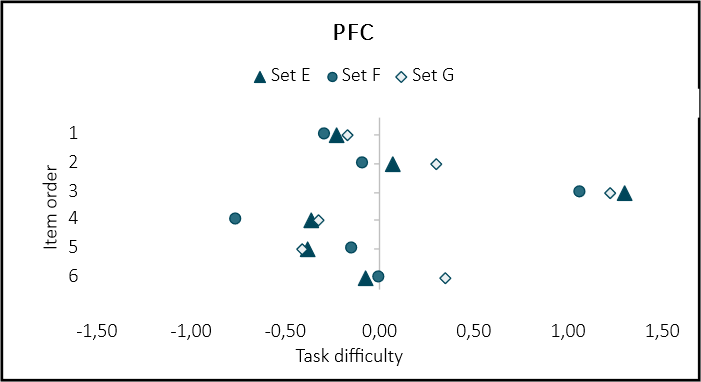
Table 5 shows the proportions used for each response option per item. In as many as 11 of 18 items (61 %), the a priori expected strongest distractor did not turn out to be the most likely incorrect response. In two of those 11 items, the empirically strongest distractors were before rather than after the key response. Notably, in the third and fourth item in each set, the same distractor in all three sets turned out to be the strongest distractor empirically; for item three distractor x and for item four distractor x were the distractors most likely to be used. In all cases, in the fifth and sixth item in each set, the strongest distractors were positioned as response option three or four. The use of the response option “Don’t know” ranged from 2.1% to 7.8% per item. When considering all responses except “Don’t know” and the key response, response options 3 and 4 were most frequently used and, therefore, considered to be the empirically strong distractors.
Table 5.
Proportions used for each response option per item.
Set | Item | Key response | A priori strongest distractor | % | % Response option 1 | % Response option 2 | % Response option 3 | % Response option 4 |
E | 1 | 4 | 3 | 3.2 | 13.5 | 16.1 | 17.2 | 50.0 |
E | 2 | 4 | 1 | 7.3 | 13.3 | 15.1 | 20.6 | 40.3 |
E | 3 | 2 | 4 | 2.1 | 30.5 | 22.0 | 23.6 | 21.8 |
E | 4 | 4 | 1 | 7.1 | 11.9 | 4.6 | 24.1 | 52.3 |
E | 5 | 3 | 4 | 2.7 | 12.1 | 13.8 | 52.8 | 18.6 |
E | 6 | 2 | 1 | 6.6 | 10.3 | 46.6 | 16.3 | 20.2 |
F | 1 | 2 | 1 | 4.5 | 11.9 | 48.3 | 20.9 | 14.3 |
F | 2 | 3 | 4 | 6.1 | 14.7 | 16.4 | 44.7 | 18.2 |
F | 3 | 3 | 4 | 3.5 | 31.6 | 21.3 | 23.4 | 20.2 |
F | 4 | 3 | 2 | 7.0 | 15.4 | 14.1 | 58.3 | 5.2 |
F | 5 | 4 | 3 | 4.0 | 13.6 | 14.0 | 22.9 | 45.5 |
F | 6 | 2 | 3 | 5.1 | 12.7 | 42.6 | 20.6 | 19.0 |
G | 1 | 4 | 1 | 3.9 | 12.1 | 21.5 | 16.3 | 46.2 |
G | 2 | 1 | 3 | 7.8 | 37.4 | 12.1 | 22.1 | 20.6 |
G | 3 | 1 | 4 | 3.0 | 21.2 | 31.5 | 23.2 | 21.1 |
G | 4 | 4 | 1 | 6.9 | 12.1 | 25.7 | 6.1 | 49.2 |
G | 5 | 3 | 1 | 3.6 | 11.5 | 19.4 | 50.8 | 14.6 |
G | 6 | 2 | 4 | 7.5 | 14.1 | 36.3 | 18.4 | 23.8 |
In all three sets, the third item had the lowest proportion of test takers giving the key response, and for Sets F and G other response options were more likely than the key response (Table 5). On closer inspection of the distractor curves for the third item, they show that for all three sets, test takers with the highest ability chose the key response.
Hypothesis
Summaries of hypothesized item-by-item differences are shown in Table 6 for H1 and H3-4 (using NS) and in Table 7 for H1-2 and H4-5 (using PFC). For each hypothesis, one column indicates the expected relationship in task difficulty (e.g. if item C is expected to be more difficult than item B, it is represented as C > B), while another column specifies whether the relationship observed matches the hypothesis (Yes/No). Statistically significant differences are marked with asterisks. Furthermore, for H5 and H6, the hypotheses were tested both according to the a priori expected and empirically strongest distractors.
Table 6.
Hypothesized item-by-item differences in NS. For each hypothesis, one column indicates the expected relationship in task difficulty and the column specifies whether the relationship observed matches the hypothesis (Yes/No). Statistically significant differences are marked with asterisks.
Items | H1 | H3 | H4 | |||
1 | C > B | Yes | ||||
2 | ||||||
3 | ||||||
4 | B > C | No | ||||
5 | C > B | Yes* | C > B | Yes* | C > B | Yes* |
6 | C > B | No | ||||
7 | C > B | Yes | ||||
8 | B > C | No | ||||
9 | C > B | Yes | B > C | No | C > B | Yes |
10 | B > C | No | C > B | Yes | ||
11 | C > B | Yes | ||||
12 | C > B | Yes | B > C | No | C > B | Yes |
13 | B >C | No | B > C | No | ||
14 | B > C | Yes | B > C | Yes | B > C | Yes |
15 | ||||||
16 | B > C | Yes | C > B | No | B > C | Yes |
* Statistically, C5 is significantly more difficult than B5 (p 0.05: t=3.53),
Note 1: Empty cells indicate that the items could not be compared for that hypothesis.
Note 2: The opposite relationship from what was hypothesized; statistically, B4 is significantly more difficult than C4 (p 0.05: t=3.02).
Table 7.
Hypothesized item-by-item differences in PFC. For each hypothesis, one column indicates the expected relationship in task difficulty and the column specifies whether the relationship observed matches the hypothesis (Yes/No). Statistically significant differences are marked with asterisks.
H1 | H2 | H5 | H6 | |||||||||||||
Item | E vs. F | F vs. G | E vs. F | F vs. G | E vs F | E vs F (empirically) | F vs G | F vs G (empirically) | ||||||||
1 | E > F | Yes | G > F | Yes | E > F | Yes | G > F | Yes | E > F | Yes | F > G | No | F > G | No | ||
2 | E > F | Yes | G > F | Yes | E > F | Yes | F > G | No | E > F | Yes | N/A | F > G | No | N/A | ||
3 | G > F | Yes | F > E | No | F > G | No | F > G | No | G > F | Yes | ||||||
4 | E > F | Yes | G > F | Yes * | E > F | Yes | G > F | Yes * | E > F | Yes | N/A | F > G | No | F > G | No | |
5 | F > E | Yes | F > G | Yes | F > E | Yes | G > F | No | F > E | Yes | E > F | No | F > G | Yes | ||
6 | E > F | No | N/A | F > G | No | N/A | ||||||||||
* Statistically, G4 is significantly more difficult than F4 (p 0.05: t=3.24)
N/A indicates that there were no differences in how the a priori expected, and empirically strongest distractors affected the hypothesis.
Note 1: Empty cells indicate that the items could not be compared for that hypothesis.
H1: Positioning the key response(s) at the edges increases the difficulty of the item
Of the eight NS items, where one or two key responses were placed at the ends, unlike their corresponding items, six showed absolute values in the expected order (Table 6, Figure 2). Notably, one of these (item 5) was significantly more difficult in Set C than in Set B (p=0.05: t=3.53), where both key responses were positioned at the edges.
For the PFC, when the absolute values were compared, all items were more difficult when the key response was positioned at one of the edges (Table 7, Figure 3). In one comparison (item 4) the difference was statistically significant when Sets F and G were compared (p=0.05: t=3.24).
Most results were directionally consistent with the hypotheses, yet did not attain statistical significance.
H2: Positioning the key response later in the order of response options increases the difficulty of the item
In terms of absolute values, the difficulty of the item increased in six of ten PFC items when the key response was positioned later in the order of response options (Table 7, Figure 3). Item 4 showed a statistically significant difference when Sets F and G were compared (p=0.05: t=3.24).
Most results were directionally consistent with the hypotheses, yet did not attain statistical significance.
H3: When two answers are required, positioning key responses in the incorrect order (i.e. presenting the second answer first) increases the difficulty of the item.
Five of eleven NS items were more difficult when the key responses were positioned in the incorrect order (Table 6, Figure 2). In one item (item 5) the difference was statistically significant (p 0.05: t=3.53).
The results are inconclusive with the hypothesis.
H4: When two answers are required, positioning the key responses further apart will increase the difficulty of the item.
The proximity of the key responses affected the difficulty of the items by increasing the difficulty – as expected – in five of six NS items; one of them (item 5) was statistically significant (p=0.05: t=3.53; Table 6, Figure 2). However, statistically, item 4 was significantly more difficult, but in the opposite direction (p 0.05: t=3.02).
Most results were directionally consistent with the hypotheses, yet two statistical significances were shown in different directions.
H5: Positioning the strongest distractor before the key response increases the difficulty of the item
When considering the a priori expected strongest distractors, items 2 and 6 in Set E were expected to be more difficult than the corresponding items in Set F, and item 5 in Set F was expected to be more difficult than the corresponding item in Set E. This was confirmed for items 2 and 5 when the absolute values of task difficulty were compared (Table 7, Figure 3). For the empirically strongest distractors, items 1 and 5 in Set E could have been expected to be more difficult than Set F (Table 5), but this was only confirmed for item 1 (Table 7, Figure 3). Nevertheless, there were no statistically significant differences in task difficulty.
Most results were directionally consistent with the hypotheses, yet did not attain statistical significance.
H6: Increasing the distance between the key response and the strongest distractor decreases the difficulty of the item
When considering the a priori strongest distractor (Table 7, Figure 3), as the distance increased, the items became more difficult for five of six items. This contrasts with what was hypothesized, and was statistically significant for item 4 (p=0.05: t=3.24). When considering the empirically strongest distractors, one of three items (item 3) became less difficult when the distance increased.
Most results were directionally inconsistent with the hypotheses, yet did not attain statistical significance.
4. Discussion
This pilot study has investigated how the position of response options in MC items affects the difficulty of items. Because the study only found a few statistically significant results, we must refrain from drawing definitive conclusions. Instead, the discussion will elaborate on the trends related to the overarching research questions and highlight the complexities inherent in this type of study.
How is the difficulty of an item affected by the placement of the key response?
In line with our first hypothesis, both NS and PFC showed a trend – albeit not statistically significant or conclusive – of increased item difficulty when key responses were positioned at the edges, corroborating earlier findings (Attali & Bar-Hillel, 2003; Bar-Hillel & Attali, 2002; DeVore et al., 2016).
As far as the second hypothesis is concerned, the results are more inconsistent. In contrast to a proposed primacy effect, the results from four PFC items in this study revealed the opposite trend; items became easier when the key response was later in the order of response options. We speculate that this reversed effect is because response options three and four are spatially closer to the end of the folding and cutting sequence in the main picture, making comparison with these response options easier. This interpretation is further supported by several of the empirically strongest distractors tending to appear at response options three or four, and after the key response (see further discussion on its implications below). In turn, this might suggest that test takers are more likely to focus initially on response options that are spatially closer to the end of the sequence, rather than working from left to right. It could be related to the type of MC item being studied, i.e. one which comprises a sequential visuospatial main picture with horizontal response options. Such a design may lead to different response patterns compared to items with text-based options, or items with vertically stacked response options.
The NS items require two key responses to be selected in the correct order. To the best of our knowledge, no prior studies have investigated the impact of the placement of two key responses. Therefore, the rationales for H3 and H4 were based on logical reasoning rather than previous empirical evidence. However, this study included only a few items and found just one statistically significant difference, i.e. positioning the key responses further apart appeared to outperform incorrect ordering of key responses in terms of making items more difficult (items 9, 12, 16; Table 6, Figure 2). The interpretation here is that placing the key responses closer together makes comparison and integration of information easier, thereby reducing cognitive load. However, edge aversion is clearly a confounding factor. As the distance between key responses increases, the likelihood of one or both key responses being positioned at the edges also increases (Table 2). Consequently, even in larger studies, disentangling the effects of response distance from other factors influencing item difficulty may be challenging.
How is the difficulty of an item affected by the placement of distractors in relation to the key response?
Before discussing the results of the hypotheses, it is important to note that in nearly two-thirds of the items, the a priori expected strongest distractor was not the most frequently chosen incorrect response, i.e. the empirically strongest distractor. This discrepancy can likely be attributed to one or two factors: the positioning of the response options may influence which distractor becomes the most attractive, or the authors’ a priori judgement of similarity of distractor and key response may have been inaccurate. A qualitative inspection of the response options, and the proportion of participants selecting each option, suggests an interaction between these two factors. In some items, it is understandable why an alternative distractor emerged as the most attractive incorrect response. However, in other cases – particularly when the empirically strongest distractor was response option three or four – it is reasonable to conclude that the positioning itself may have influenced the likelihood of it being selected as the strongest distractor.
In three out of four PFC items, the item became more difficult when the strongest distractor was placed before the key response, supporting H5. However, in two of those three items, the key response was positioned at the edge. Thus, it is not possible to know whether the difference in difficulty is related to edge aversion (Attali & Bar-Hillel, 2003). Nor is it possible to know whether the response options before the key response were likely to divert test takers’ attention and interfere with the key response to the extent that they believed them to be correct (Kiat et al., 2018).
From PFC Sets F and G, our results showed that the test takers did not find it more difficult to differentiate between the key response and the strongest distractor, if they were placed close to one another. This is in contrast to an earlier proposal by Shin et al (2020). Nevertheless, as for H5, when the distance increased, the key response was often positioned at the edge, and this is likely confounding our ability to analyze the effect of the proximity of the key response to the strongest distractor.
Methodological considerations
The study design may have been overly ambitious in attempting to isolate the unique effects outlined in the hypotheses. One contributing factor is that even minor adjustments to response option positions could introduce unintended changes. For example, increasing the distance between key responses in the NS items, or between the key response and the strongest distractor in the PFC items, often resulted in the key response being positioned at the edge(s). While additional response options could have mitigated the impact of edge aversion when increasing distances, the number of response options in this study was fixed due to technical constraints. However, with more response options, another issue will arise. Distractors must have a certain degree of plausibility and contribute to the discrimination of responses, otherwise they become ineffective (Gierl et al., 2017). Therefore, disentangling the effects of response distance from other factors that influence item difficulty remains a challenge, because modifying one variable may inadvertently affect other aspects.
An additional challenge in addressing the hypotheses in this study was that the a priori expected strongest distractors in the PFC items did not always align with the empirically strongest distractors. As discussed above, two potential explanations for this discrepancy are author misjudgment and a possible position effect. This raises a further question: how can the effectiveness of distractors be objectively and quantitatively defined? Although the PFC test is considered a logical reasoning test, it also incorporates visuospatial components. In the field of visual perception, van der Helm (2000) discussed two key principles: the likelihood principle (Helmholtz, 1962) and the simplicity principle (Hochberg & McAlister, 1953). While the first principle states that the visual system will prefer the most likely interpretation, the latter states that the simplest interpretation is preferred. However, these principles may be difficult – or even impossible – to separate and they may result in the same predictions, but by means of very different lines of reasoning (van der Helm, 2000, p. 770). Furthermore, it has been emphasized the importance of distinguishing between relationships within the measurement mechanism and causal explanations of task difficulty (Melin & Pendrill, 2023). Specifically, the way measurement information propagates through a measurement system is distinct from how attributes are intrinsically associated with an object, and is not primarily influenced by the measurement mechanism itself. Thus, to determine whether a position effect influences which distractor emerges as the empirically strongest – and consequently affects task difficulty – it is essential to separate this effect from an objective definition of distractor effectiveness.
Recently, Hagenmüller (2021) claimed that it is possible to vary the item difficulty of knowledge items, regardless of item content, only by changing the position of the solution among the response options. Our results somewhat contradict that this applies regardless of item content. In this study, although not statistically significant, the easier NS items seem to be more affected by the changed position of distractors than more difficult NS items or the PFC items (Figure 2 and 3). Whether different item types, or items with different levels of difficulty, have greater or lesser sensitivity to changing the order of response options remains to be examined further.
In the present study, all test takers had completed regular cognitive tests, in up to 80 minutes, before they received the items under development for the updated SEB. As it was not explained to the test takers which items were the regular items, and which were under development can have, the test takers had no reason to disengage selectively, which likely helped sustain effort even in the presence of fatigue. Moreover, because the anchor sets (Set A for NS and Set D for PFC) was always administered first, any fatigue effects would be expected to influence the other items similarly; consequently, comparisons of task difficulty among those sets should be only minimally affected. A further consideration concerns the potential impact of unequal group composition: the proportions of test takers differed across age and selection groups. However, because we observed no DIF and no differences in estimated ability across groups in the anchor sets, any influence of these compositional differences on the results is likely negligible.
Distractor analysis is a crucial process for helping test developers understand why test takers make errors, by supporting diagnostic inferences about test performance (Gierl et al., 2017). This analysis can be conducted using descriptive statistics to identify nonfunctional distractors – those with low response frequencies – or through IRT models to examine distractor performance in relation to test takers’ abilities. In this study, due to the small number of items and complexity, we chose only a few basic methods. In forthcoming work, complements such as eye-tracking (Holzknecht et al., 2021) and a point‐biserial discrimination index of distractors (Attali & Fraenkel, 2000) may provide additional insights into the overall functionality of distractors in MC items.
Given the complexity of distractor patterns and the limited number of significant differences, questions arise regarding the practical implications of this type of research. However, it is widely accepted that the quality of test items – be they multiple-choice or other formats – is fundamental to the validity and reliability of assessments. Poorly constructed items, such as those with ambiguous wording or culturally biased content, can lead to misinterpretation or create inequities among test takers. Producing high-quality items requires careful attention during their construction, and robust review and validation procedures (Morrison & Embretson, 2018). As Rodriguez (1997) aptly noted, “Item writing has been, is, and always will be an art […] Item writing is also serious business,” underscoring the importance of combining creativity with rigorous standards in item development. Therefore, we argue that while the items fit the model, and their composition yields valid and reliable measures, a deeper understanding of how the positioning of key responses and distractors influences item difficulty will contribute to broader theoretical insights. This, in turn, can enhance item development and provide better guidance for constructing MC items.
5. Conclusion
The difficulty of an item may be influenced by the placement of the key response and the relative positioning of distractors. However, given the limited number of significant findings and occasional inconsistencies in trends, a key takeaway from this study is that examining the effects of ordering, and the influence of distractors in MC items is inherently complex. Isolating unique effects is challenging, as even minor adjustments to response option positions can introduce unintended changes.
Whether different item types, or items of varying difficulty, exhibit differing sensitivity to response option order remains an open question for further investigation. However, preliminary indications suggest that easier NS items may be affected more by distractor positioning than more difficult NS items or PFC items. Additionally, findings from the PFC items indicate that task-specific characteristics, particularly spatial organization, may interact with response placement. This interaction could create a visual focus that, in turn, influences item difficulty. Nevertheless, further research is required to disentangle the interplay between primacy effects, edge aversion, and spatial proximity in shaping response patterns across different item types.
Acknowledgment
The authors would like to express their appreciation to the whole research team working to update the existing Swedish Enlistment Battery: Dr. Maria Fors Brandebo, Dr. Stefan Annell, Dr. Eva Johansson, Prof. Gerry Larsson, Emma Oskarsson (all Swedish Defence University), and Dr. Daniel Bergh (University of Gothenburg), for valuable feedback during the study.
Funding details and disclosure statement
This study is a part of the Swedish Defence Conscription and Assessment Agency's work to update the existing Swedish Enlistment Battery. The work has been partially funded by the Swedish Defence Conscription and Assessment Agency. Beyond that, the authors have no conflicts of interest to declare.
Data Availability Statement
The data that supports the findings of this study has been retrieved from the Swedish Defence Conscription and Assessment Agency. Restrictions apply to the availability of this data, which was used under license for this study.
How to Cite
Melin, J., & Wahlkrantz, E. (2026). The interplay between key responses, distractors, and position effects in multiple-choice items: A complex and unresolved issue. Educational Methods & Psychometrics, 4 (SAMC 2024 Special Issue): 24.
References
Attali, Y., & Bar-Hillel, M. (2003). Guess where: The position of correct answers in multiple-choice test items as a psychometric variable. Journal of Educational Measurement, 40(2), 109–128.
Attali, Y., & Fraenkel, T. (2000). The point-biserial as a discrimination index for distractors in multiple-choice items: deficiencies in usage and an alternative. Journal of Educational Measurement, 37(1), 77–86.
Andrich, D., Sheridan, B., & Luo, G. (2012). RUMM2030+ [Computer software]. RUMM Laboratory Pty Ltd, Perth, WA.
Bar-Hillel, M., & Attali, Y. (2002). Seek whence: Answer sequences and their consequences in key-balanced multiple-choice tests. American Statististical Association, 56(4), 299–303. https://doi.org/10.1198/000313002623
Carnegie, J. A. (2017). Does correct answer distribution influence student choices when writing multiple choice examinations? The Canadian Journal for the Scholarship of Teaching and Learning, 8(1), Article 1. https://doi.org/10.5206/cjsotl-rcacea.2017.1.11
DeVore, S., Stewart, J., & Stewart, G. (2016). Examining the effects of testwiseness in conceptual physics evaluations. Physical Review Physics Education Research, 12(2), 020138. https://doi.org/10.1103/PhysRevPhysEducRes.12.020138
French, J. W., Ekstrom, R. B., & Leighton, A. P. (1963). Manual for kit of reference tests for cognitive factors (p. 127). Educational Testing Service.
Garcia-Segarra, P., Santamarta, V., & Falomir, Z. (2024). Educating on spatial skills using a paper-folding-and-punched-hole videogame: Gameplay data analysis. Frontiers in Education, 9. https://doi.org/10.3389/feduc.2024.1303932
Gierl, M. J., Bulut, O., Guo, Q., & Zhang, X. (2017). Developing, analyzing, and using distractors for multiple-choice tests in education: A comprehensive review. Review of Educational Research, 87(6), 1082–1116. https://doi.org/10.3102/0034654317726529
Guttman, L., & Schlesinger, I. M. (1967). Systematic construction of distractors for ability and achievement test items. Educational and Psychological Measurement, 27(3), 569–580. https://doi.org/10.1177/001316446702700301
Hagenmüller, B. (2021). On the impact of the response options’ position on item difficulty in multiple-choice-items. European Journal of Psychological Assessment, 37(4), 290–299. https://doi.org/10.1027/1015-5759/a000615
Haladyna, T., & Rodriguez, M. C. (2013). Selected-response format: Developing multiple-choice items. In Developing and Validating Test Items. Routledge.
Helmholtz, H. von. (1962). Treatise on physiological optics (J. P. C. Southall, Trans. and Ed.). Dover Publication.
Hobart, J., & Cano, S. (2009). Improving the evaluation of therapeutic interventions in multiple sclerosis: The role of new psychometric methods. 2009, 214.
Hochberg, J., & McAlister, E. (1953). A quantitative approach, to figural ‘goodness’. Journal of Experimental Psychology, 46(5), 361–364. https://doi.org/10.1037/h0055809
Hohensinn, C., & Baghaei, P. (2017). Does the position of response options in multiple-choice tests matter? Psicológica, 38, 93–109.
Holzknecht, F., McCray, G., Eberharter, K., Kremmel, B., Zehentner, M., Spiby, R., & Dunlea, J. (2021). The effect of response order on candidate viewing behaviour and item difficulty in a multiple-choice listening test. Language Testing, 38(1), 41–61. https://doi.org/10.1177/0265532220917316
Irvine, S. H., Dann, P. L., & Anderson, J. D. (1990). Towards a theory of algorithm-determined cognitive test construction. British Journal of Psychology, 81(2), 173–195.
Jonsson, E., Salo, M., Lillemäe, E., Steder, F. B., Ferst, T., Kasearu, K., Novagrockiene, J., Österberg, J., Sederholm, T., Svensén, S., Tresch, T. S., & Truusa, T.-T. (2024). Multifaceted conscription: A comparative study of six European countries (1). 7(1), Article 1. https://doi.org/10.31374/sjms.166
Kiat, J. E., Ong, A. R., & Ganesan, A. (2018). The influence of distractor strength and response order on MCQ responding. Educational Psychology, 38(3), 368–380. https://doi.org/10.1080/01443410.2017.1349877
Lions, S., Dartnell, P., Toledo, G., Godoy, M. I., Córdova, N., Jiménez, D., & Lemarié, J. (2023). Position of correct option and distractors impacts responses to multiple-choice items: Evidence from a national Test. Educational and Psychological Measurement, 83(5), 861–884. https://doi.org/10.1177/00131644221132335
Ludvigsson, J. F., Berglind, D., Sundquist, K., Sundström, J., Tynelius, P., & Neovius, M. (2022). The Swedish military conscription register: Opportunities for its use in medical research. European Journal of Epidemiology, 37(7), 767–777. https://doi.org/10.1007/s10654-022-00887-0
Melin, J., & Pendrill, L. R. (2023). The role of construct specification equations and entropy in the measurement of memory. In Jr. Fisher William P. & S. J. Cano (Eds.), Person-centered outcome metrology: Principles and applications for high stakes decision making (pp. 269–309). Springer International Publishing. https://doi.org/10.1007/978-3-031-07465-3_10
Morrison, K., & Embretson, S. (2018). Item generation. In The Wiley handbook of psychometric testing: A multidisciplinary reference on survey, scale and test development (1st edition). Wiley-Blackwell.
Rodriguez, M. C. (1997). The art & science of item-writing: A meta-analysis of multiple-choice item format effects.
Rodriguez, M. C. (2005). Three options are optimal for multiple-choice items: A meta-analysis of 80 years of research. Educational Measurement: Issues and Practice, 24(2), 3–13. https://doi.org/10.1111/j.1745-3992.2005.00006.x
Salgado, J. F. (2017). Using ability tests in selection. In H. W. Goldstein, E. D. Pulakos, J. Passmore, & C. Semedo (Eds.), The Wiley Blackwell handbook of the psychology of recruitment, selection and employee retention (1st ed., pp. 113–150). Wiley. https://doi.org/10.1002/9781118972472.ch7
Schroeder, J., Murphy, K. L., & Holme, T. A. (2012). Investigating factors that influence item performance on ACS exams. Journal of Chemical Education, 89(3), 346–350. https://doi.org/10.1021/ed101175f
Shin, J., Bulut, O., & Gierl, M. J. (2020). The effect of the most-attractive-distractor location on multiple-choice item difficulty. The Journal of Experimental Education, 88(4), 643–659. https://doi.org/10.1080/00220973.2019.1629577
Swedish Police Authority. (n.d.). polisen.se. Retrieved 22 January 2025, from https://polisen.se/jobb-och-utbildning/bli-polis/antagningskrav/
Tennant, A., & Conaghan, P. G. (2007). The Rasch measurement model in rheumatology: What is it and why use it? When should it be applied, and what should one look for in a Rasch paper? Arthritis & Rheumatism, 57(8), 1358–1362. https://doi.org/10.1002/art.23108
Thissen, D., Steinberg, L., & Fitzpatrick, A. R. (1989). Multiple-choice models: The distractors are also part of the item. Journal of Educational Measurement, 26(2), 161–176.
van der Helm, P. A. (2000). Simplicity versus likelihood in visual perception: From surprisals to precisals. Psychological Bulletin, 126(5), 770–800. https://doi.org/10.1037/0033-2909.126.5.770
Wahlkrantz, E., & Melin, J. (2025). Fair assessment of logical ability in military selection: A Rasch analysis of a paper fold and cut test. SAGE Open 15, nr 3 (2025): 21582440251372266. https://doi.org/10.1177/21582440251372266.
Manuscript Received: 26 FEB 2025
Final Version Received: 02 DEC 2025
Published Online Date: 15 FEB 2026
Appendix
The Interplay Between Key Responses, Distractors, and Position Effects in Multiple-Choice Items: A Complex and Unresolved Issue
Person-item histogram for NS. Level CD (blue) indicates Set A and B and level CE indicates Set A and C.
Person-item histogram for PFC. Level 1(blue) indicates Set A and B, level 2 indicates Set A and B, and level 3 indicates Set A and C.
PUBLISHED
ISSUE
