Full Html
Full Html
1. Introduction
Parkinson’s disease (PD) is a common progressive neurodegenerative disorder with a typical onset around 50-60 years of age that affects an estimated 0.3% of the population at large and 1% of people above 60 years of age (de Lau & Breteler, 2006). It is characterized by motor symptoms (bradykinesia, rigidity, tremor, postural impairment) as well as non-motor symptoms, e.g., cognitive dysfunction, anxiety, depression, sleep disorders, fatigue, pain, and dysautonomia (Jankovic, 2008; Schapira et al., 2017). Symptomatic pharmacotherapy is generally successful but typically compromised by complications such as a fluctuating drug response and dyskinesias that develop over time and contribute to long term deteriorating well-being and increasing dependence (Haahr et al., 2021; Haahr et al., 2011; Sjodahl Hammarlund et al., 2018). The need for high quality means of assessing disease impact and therapeutic responses from the perspective of persons with PD (PwPD) is therefore obvious.
Patient-reported outcomes (PROs) complement clinical assessments by providing valuable insights into the patient's perspective. For example, PROs are central for assessment of non-observable aspects of PD such as non-motor symptoms, perceived health, and overall well-
Correspondence should be made to Peter Hagell, Faculty of Health Sciences, Kristianstad University, Kristianstad, Sweden. Email: Peter.Hagell@hkr.se
© 2026 The Authors. This is an open access article under the CC BY 4.0 license (https://creativecommons.org/licenses/by/4.0/)
being. The most widely used PD-specific PRO scale is the 39-item PD Questionnaire (PDQ-39) and its 8-item short-form (PDQ-8) (Berardi et al., 2021). The PDQ-39 was developed to assess functioning and well-being (Peto et al., 1995), but has typically been used to assess, e.g., health status, health-related quality of life and quality of life (Berardi et al., 2021; Martinez-Martin et al., 2011; Ruotolo et al., 2024). The PDQ-39 was derived from interviews with 20 PwPD in the UK, which yielded a 65-item questionnaire. This was then reduced to 39 items assumed to represent 8 scales based on principal component analysis with varimax rotation of item responses to a postal survey (Peto et al., 1995). Subsequently, Jenkinson et al. proposed an 8-item short-form, the PDQ-8 (Jenkinson et al., 1997), which has gained increasing popularity and is now commonly recommended and used in clinical PD research and practice (Berardi et al., 2021; De Roos et al., 2017; Martinez-Martin et al., 2011; Ruotolo et al., 2024). As such, the PDQ-8 is influential in decision-making processes that impact the care of PwPD.
Both the PDQ-39 and PDQ-8 have been extensively tested regarding their psychometric properties. However, with few exceptions these evaluations have been conducted according to traditional psychometric approaches. While most or all of these studies have supported the reliability and validity of the PDQ-39 and PDQ-8 (Ruotolo et al., 2024), evaluations based on Rasch measurement theory (RMT) have not. For example, the dimensionality of the PDQ-39 has been challenged, as has the empirical functioning of its response categories, differential item functioning (DIF) by age and sex has also been reported, and the questionnaire appears to represent more severe health problems than that experienced by PwPD (Hagell & Nilsson, 2009; Hagell & Nygren, 2007; Hagell et al., 2003). As expected, similar findings have been reported from RMT analyses of the PDQ-8, thus suggesting issues with its dimensionality, response categories and targeting (Franchignoni et al., 2008). However, these studies were based on relatively limited sample sizes (of about n=200 per study). Additionally, no study on either the PDQ-39 or the PDQ-8 has specifically addressed the local independence assumption. Local dependence can be of two principal kinds: local response dependence (a form of redundancy where the response to an item is influenced by the response/s to other item/s) and local trait dependence (multidimensionality) (Marais & Andrich, 2008). While unidimensionality often has been addressed in RMT based studies, local response dependence has not (Tennant & Küçükdeveci, 2023). However, more recent studies have illustrated the importance of taking local dependence (LD) into account when testing the quality of health outcome measures, see e.g., (Caselli et al., 2023). Given the central role of the PDQ-8 in clinical PD research and practice, there appears to be a need to revisit its psychometric properties particularly in terms of local dependence.
This paper reports observations from an RMT based examination of the PDQ-8 using data from a Swedish quality register. The aim of the study was to examine the measurement properties of the PDQ-8, specifically focusing on local dependence.
2. Methods
The study was approved by the Swedish Ethical Review Authority (Dnr. 2013/374 and 2019/05791).
2.1 Sample
Data were taken from the Swedish national registry for Parkinson’s disease (ParkReg; www.neuroreg.se), which includes demographic variables, diagnosis, treatments, and clinician and patient-reported assessments (e.g., the PDQ-8). ParkReg was established in 2011 and is estimated to cover approximately one third of PwPD in Sweden as a whole and about half in Scania, the southernmost area of Sweden. For further information on ParkReg, see Aström et al. (Astrom et al., 2022).
The sample in this study consisted of 1316 people with PD from Scania who had completed the PDQ-8 as of April 2020. Some of these had completed the PDQ-8 on more than one occasion, whereas some only had completed it when entering ParkReg. This study used the first entry of each person. Furthermore, those who did not provide complete responses (n=27) were omitted, leaving data from a total sample of 1289 PwPD available for analysis. Sample characteristics are summarized in Table 1.
Table 1.
Sample characteristics (n=1289) a
Age (years). median (q1-q3; min-max) | 72 (65-76; 26-96) | |
Sex, n (%) | ||
| Male | 817 (63.4) |
| Female | 472 (36.6) |
Hoehn & Yahr stage of PD b, median (q1-q3; min-max) | I.5 (II-III; 0-V) c | |
PD duration (years), median (q1-q3; min-max) | 4 (2-8; 0-34) | |
Motor complications d, n (%) | 660 (58.9) e | |
a Excluding persons with missing PDQ-8 item responses (n=27)
b Stage 0, no sign of disease; Stage I, unilateral disease; Stage II, bilateral disease without postural instability; Stage III, bilateral disease with postural instability, somewhat restricted in activities but capable of leading an independent life, mild to moderate disability; Stage IV, severely disabled, still able to walk and stand unassisted but markedly incapacitated; Stage V, confinement to chair or bed unless aided (Hoehn & Yahr, 1967; Fahn et al., 1987).
c Missing data for n=172.
d Motor fluctuations and/or dyskinesias.
e Missing data for n=169.
2.2 Instrument
The PDQ-8 consists of 8 items from the PDQ-39, where each item represents one of the 8 PDQ-39 scales. Item selection for the PDQ-8 was based on data from the original development of the PDQ-39 (Peto et al., 1995) and was guided by correlations between each item score and the total score of the PDQ-39 scale that they are proposed to represent (Jenkinson et al., 1997). The item with the strongest Pearson product-moment correlation with its proposed PDQ-39 subscale was selected to represent that scale (Jenkinson et al., 1997). Each item represents a PD related health problem and respondents are requested to affirm one of five ordered response categories (never – occasionally – sometimes – often – always; scored 0-4, respectively) according to how often, due to their PD, they have experienced each problem during the past month. Item responses are summed into a total score that may range between 0 and 32 (higher scores=worse), which typically is transformed ((total score/32) x 100) into a 0-100 range (Jenkinson et al., 1997).
In addition to the PDQ-8, data regarding age, sex, time since PD diagnosis, PD severity according to Hoehn & Yahr (Fahn et al., 1987; Hoehn & Yahr, 1967), and motor complications were used for descriptive purposes.
2.3 Analyses
Demographic and other descriptive data were analyzed using n (%), median (q1-q3; min-max) and mean (SD; min-max), as appropriate.
RMT analyses of complete PDQ-8 item response data were conducted according to the unrestricted (“partial credit”) polytomous Rasch model using the RUMM2030plus software (RUMM Laboratory Pty Ltd., Perth, WA, Australia), with the sample divided into ten class intervals (subgroups with similar levels according to their estimated locations). Additional analyses were conducted in R version 4.4.2 using the eRm, iarm and easyRasch packages (Johansson, 2025; Mair et al., 2024; Müller, 2022). Adjustments for multiple null hypothesis testing were applied (alpha level of significance, 0.05).
According to RMT (Andrich & Marais, 2019; Rasch, 1960), the probability of a certain item response is a function of the difference between the level of the measured construct (e.g., health problems) represented by the item and that possessed or experienced by the person. With polytomous items (i.e., more than two ordered response categories), this corresponds to the difference between the person’s level on the construct and the locations of the thresholds that define the boundaries between adjacent response categories along the construct’s continuum. The model separately locates persons and items on a common interval level logit (log-odd units) metric, ranging from minus to plus infinity (with mean item location set at zero). Locations of persons who score at the floor or ceiling (lowest and highest possible score, respectively) cannot be estimated but are extrapolated to yield rough locations (albeit with large levels of uncertainty) to allow their inclusion in further analyses. RUMM2030plus derives these extrapolated estimates using a geometric mean algorithm that uses the three lowest (for those scoring 0) and highest (for those with max scores) person location estimates, respectively (Andrich & Marais, 2019).
If data accord sufficiently to the model, linear measurement and invariant comparisons can be achieved. A core assumption of the Rasch model (as well as other psychometric approaches) is that item responses should be locally independent. This means that item responses should be conditionally independent given the latent variable, i.e., that responses are not influenced by responses to other items, or other factors, after controlling for person location on the latent variable (Andrich & Marais, 2019; Christensen et al., 2017; Marais, 2013; Marais & Andrich, 2008; Yen, 1993).
Analyses in this paper focused on the following measurement aspects: targeting, reliability, model fit, DIF by sex and age (as defined by the median, i.e., 72 years), response category functioning, and the local independence assumption (including unidimensionality). Details on these analyses are available elsewhere (Andrich & Marais, 2019; Christensen et al., 2017; Hagquist & Andrich, 2017; Marais, 2013; Wright & Masters, 1982). Analyses were conducted stepwise and interactively, as described in the Results section.
3. Results
Descriptive reporting
The mean person location was -1.30 (SD, 0.91) suggesting that the PDQ-8 tends to represent more severe health problems than that experienced by the sample, as 22% of the sample had locations lower than that of the PDQ-8 (Fig. 1A). There was no ceiling effect, i.e., no person reported the highest (worst) possible PDQ-8 score, but a 7.2% floor effect (i.e., 93 persons scored 0). Higher levels on the measurement continuum (i.e., more health problems) were poorly represented by the sample and there were also some gaps in the ability of the scale to cover this segment of the continuum.
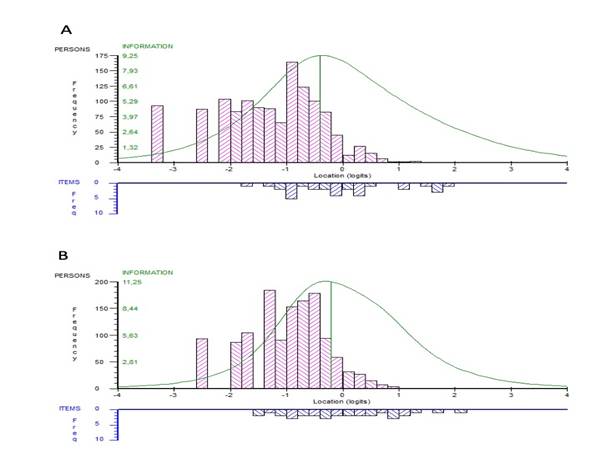
Figure 1. Distribution of locations of persons (upper panel) and PDQ-8 response category thresholds (lower panel) on the common logit metric (x-axis; negative values = better) from (A) item level and (B) subtest analyses.
Table 2.
Rasch model summary statistics
Item level | Subtests | |
Person location, mean (SD; min – max) | -1.30 (0.91; -3.25 – 1.29) | -0.98 (0.70; -2.49 – 0.97) |
Person fit residuals, mean (SD; min – max) | -0.26 (1.07; -6.26 – 2.82) | -0.44 (0.82; -2.70 – 1.51) |
Misfitting persons, n (%) a | 43 (3.6%) | 19 (1.6%) |
Item location, mean (SD) | 0 (0.33) | 0 (0.04) |
Item fit residuals, mean (SD) | -0.29 (2.55) | -0.08 (0.55) |
Item-trait interaction, Chi-square (df); P-value | 198.44 (72); <0.001 | 67.75 (18); <0.001 |
Reliability (PSI); difference b | 0.68; n/a | 0.58; -0.10 |
Strata c | 2.25 | 1.9 |
c d | - | 0.62 |
r e | - | 0.72 |
A f | - | 0.86 |
t-test, P<0.05 (95%CI) g | 2.64% (1.88 – 3.67) | 1.01% (0.57 – 1.74) |
SD, standard deviation; df, degrees of freedom; PSI, person separation index; n/a, not applicable.
a Fit residuals outside the ±2.5 range among persons with nonextreme scores (n=1196).
b Difference between item level and subtest analyses.
c Number of statistically distinct groups of people (separated by ≥3 standard errors) that can be distinguished (Wright & Masters, 1982).
d Variance that is unique to the subtests.
e Latent correlation between subtests. corrected for attenuation due to measurement errors.
f Non-error variance common to subtests.
g Proportion (95% Agresti-Coull confidence interval) of persons with significantly (P<0.05) different person locations as estimated from two subsets of items.
Reliability (Person Separation Index, PSI) was estimated to 0.68, which corresponds to 2.2 strata and suggests limited ability to separate between persons in the sample (Table 2). This was also reflected in relatively large measurement uncertainties, particularly at the lower and upper ranges of the measurement continuum (Fig. 2).
Item locations (i.e., the mean of response category threshold locations) ranged about 1.6 logits, between -0.430 and 0.629 logits (Table 2). Item 2 represented the lowest level of PD related health problems in the PDQ-8 and was thus the easiest item to endorse, whereas item 4 represented the highest location. It is also noted that several item locations tended to cluster, where items 5-8 represented approximately the same locations (particularly when taking their measurement uncertainties into account); the same was true for items 1 and 3 (Fig. 3).
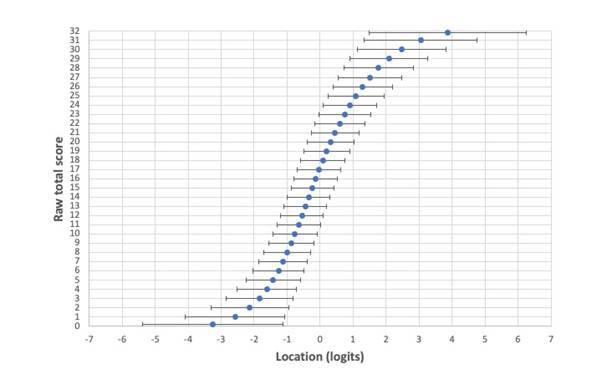
Figure 2. Relationship between raw total PDQ-8 scores (y-axis) and their estimated linear locations on the logit metric (x-axis) with lower and upper 95% CI limits of uncertainty (±1.96SE; represented by horizontal error bars) across the full range of all possible raw total scores.
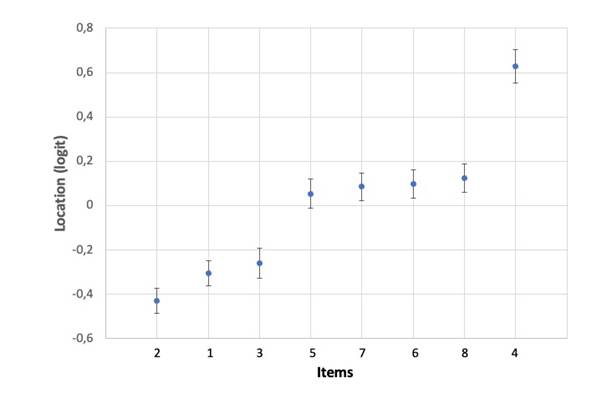
Figure 3. Hierarchical item ordering with item locations on the y-axis (negative values = better) and item numbers on the x-axis (see Table 1 for item descriptions). Error bars are uncertainties (±95% CIs) from item level analysis.
Table 3 reports item level fit statistics. Items 1 and 7 exhibited large fit residuals (-3.262 and 4.993, respectively) and significant chi-square values. In addition, items 3 and 4 showed significant chi-square values but fit residuals within the ±2.5 range. Unconditional fit statistics such as those in RUMM2030 are known to be biased (particularly with larger samples) (Müller, 2020). Two alternative item fit was therefore also considered: Comparison of observed and expected item-restscore correlations using Goodman & Kruskal’s Gamma (????) (Christensen & Kreiner, 2013; Kreiner, 2011) and conditional infit statistics (Müller, 2020). Item-restscore correlations suggested misfit for items 1, 4, 6, 7 and 8 (Table 4); infit flagged items 1, 7 and 8 as misfitting according to simulation based cutoff threshold values, of which item 7 was statistically significant. Person fit residuals among those with nonextreme scores (n=1196) ranged between -6.260 and 2.821, and a total of 43 persons (3.3%) exhibited fit residuals outside the ±2.5 range.
Table 3.
RUMM2030 item and subtest level Rasch model locations. fit statistics. DIF and response category threshold ordering.
Items/subtests | Location (SE) a | Fit Residual b | Chi-square | P-value c | DIF d | Thresholds |
1 Getting around in public | -0.304 (0.029) | -3.262 | 33.70 | <0.001 | A | Disordered |
2 Difficult dressing | -0.430 (0.029) | -0.831 | 20.64 | 0.014 | A; (S) | Disordered |
3 Depressed | -0.259 (0.034) | -0.441 | 24.76 | 0.003 | S | Ordered |
4 Relationship problems | 0.629 (0.039) | -2.107 | 27.33 | 0.001 | (A) | Disordered |
5 Concentration problems | 0.054 (0.033) | -1.158 | 19.25 | 0.023 | - | Disordered |
6 Communication problems | 0.098 (0.033) | -1.184 | 18.92 | 0.026 | - | Disordered |
7 Cramps or spasms | 0.085 (0.032) | 4.993 | 42.17 | <0.001 | (A) | Disordered |
8 Embarrassed in public | 0.125 (0.033) | 1.636 | 11.67 | 0.232 | - | Disordered |
Subtest 1 (items 1, 2, 7, 8) | 0.027 (0.014) | -0.468 | 3.85 | <0.001 | A | Ordered |
Subtest 2 (items 3, 4, 5, 6) | -0.027 (0.015) | 0.308 | 30.90 | <0.001 | (A) | Ordered |
SE, standard error; DIF, differential item functioning; A, age; S, sex.
a Item locations are expressed in logit values and represent the mean of each item’s response category threshold locations. Negative locations represent less PD related health problems and positive locations represent more PD related health problems according to the PDQ-8.
b Standardized fit residuals represent discrepancies between observed and model expected responses; should range between +/-2.5.
c P-values are unadjusted; bold values represent significance at the 0.05 level following Benjamini-Hochberg adjustment for multiple null hypothesis testing.
d Factors in parentheses represent artificial DIF.
Table 4.
Item and subtest level Rasch model fit based on comparisons of observed and expected item-restscore correlations (Goodman & Kruskal’s ????) and conditional infit statistics.
Item-restscore ???? correlations a | Conditional infit | |||||||
Items | Obs. ???? | Exp. ???? | P-value b | Infit c | Thresholds d | P-value b | ||
1 Getting around in public | 0.598 | 0.512 | <0.001 | 0.885 | 0.895, 1.095 | 0.007 | ||
2 Difficult dressing | 0.518 | 0.507 | 0.583 | 1.008 | 0.918, 1.095 | 0.847 | ||
3 Depressed | 0.521 | 0.482 | 0.060 | 0.935 | 0.934, 1.079 | 0.087 | ||
4 Relationship problems | 0.549 | 0.464 | 0.001 | 0.931 | 0.914, 1.079 | 0.163 | ||
5 Concentration problems | 0.518 | 0.489 | 0.181 | 0.942 | 0.923, 1.086 | 0.133 | ||
6 Communication problems | 0.538 | 0.488 | 0.022 | 0.926 | 0.91, 1.102 | 0.050 | ||
7 Cramps or spasms | 0.334 | 0.493 | <0.001 | 1.290 | 0.914, 1.11 | <0.001 | ||
8 Embarrassed in public | 0.428 | 0.486 | 0.024 | 1.109 | 0.908, 1.09 | 0.014 | ||
Subtest 1 (items 1, 2, 7, 8) | 0.501 | 0.499 | 0.919 | 1.001 | 0.993, 1.007 | 0.963 | ||
Subtest 2 (items 3, 4, 5, 6) | 0.501 | 0.499 | 0.919 | 1.001 | 0.993, 1.007 | 0.963 | ||
Obs., observed; Exp., expected.
a Should be nonsignificant.
b P-values are unadjusted; bold values represent significance at the 0.05 level following Benjamini-Hochberg adjustment for multiple null hypothesis testing.
c Bold values are outside the simulated cutoff threshold values.
d Based on thresholds from 400 simulated datasets (Johansson, 2025).
DIF was tested by 2-way ANOVA of the residuals across class intervals (subgroups of people with similar PDQ-8 scores) for sex and age (Hagquist & Andrich, 2017). Signs of DIF by age and sex were found for four and two items, respectively. Following adjustments for DIF by splitting items with the most pronounced DIF into subgroup specific items (Brodersen et al., 2007), three instances of real DIF remained: 3 by sex and items 1 and 2 by age (Table 3).
All items but one (item 3) had disordered response category thresholds, indicating that the five ordered response categories do not work as expected in practice (Andrich, 2011). In all instances, the disordering involved response category 1 (occasionally), as illustrated in Figure 4.
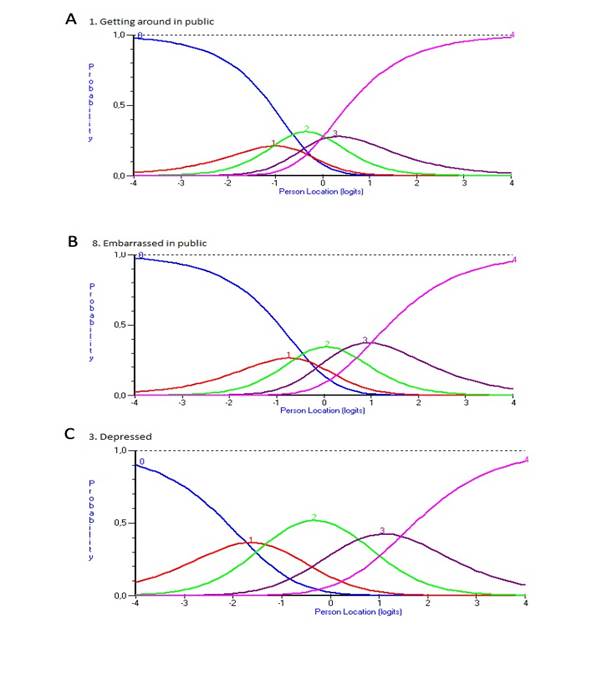
Figure 4. Response category functioning for PDQ-8 items. Each colored category probability curve represents the probability (y-axis) of responding in that response category relative to various estimated person logit locations (x-axis). Panels A and B illustrate patterns of disordered thresholds for items 1 and 8, respectively. For comparison, panel C illustrates the item without disordered thresholds (item 3).
Local dependence
The local independence assumption was examined through the matrix of correlations between standardized item fit residuals. In doing so, residual correlations (Q3*) were considered relative to the average correlation in the matrix; high relative correlations indicate violation of the local independence assumption (Christensen et al., 2017; Marais, 2013). The critical Q3* value for the presence of local dependence (LD) relative to the average correlation was determined using the web application (http://publicifsv.sund.ku.dk/~kach/Q3/critical_values_Yens_Q3.html) by Christensen et al. (Christensen et al., 2017) and found to be 0.1. This suggested LD for three item pairs (items 1&2, 3&4, and 5&6). To absorb LD, these item pairs were combined into subtests (Andrich, 1985), which revealed additional LD. Stepwise creation of subtests, starting with the item pair that displayed the largest relative Q3* value revealed additional LD: (i) items 1&2; (ii) items 4&5; (iii) items 4+5&3; (iv) items 3+4+5&6; (v) items 1+2&7; (vi) items 1+2+7&8. This led to the identification of two subtests with four items each: items 1, 2, 7, 8 (subtest 1) and items 3, 4, 5, 6 (subtest 2). Subtests yielded a mean (SD) person location of -0.98 (0.7) logits (Fig. 1B). Overall item-trait interaction remained significant, whereas fit residuals, ICCs, DIF, and the proportion of misfitting persons improved (Tables 2 and 3). Furthermore, as opposed to what was observed in the item level analysis, the merged subtest response category thresholds were ordered (Fig. 5).
The two identified subtests were then analysed separately to explore if they represented two individually coherent scales. Both exhibited overall and item level misfit, and signs of LD. Reliability estimates (PSI) were 0.29 for items 1, 2, 7, 8 (subtest 1) and 0.52 for items 3-6 (subtest 2). Response category thresholds were disordered for all subtest 1 items but ordered among all subtest 2 items.
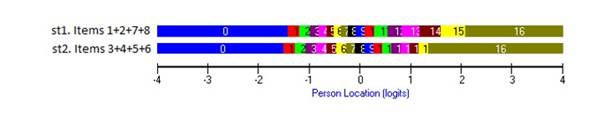
Figure 5. Response category functioning for two subtests (st1: items 1, 2, 7 and 8; st2: items 3-6) of PDQ-8 items. Intersections between color bars represent response category thresholds.
PSI decreased in the subtest analysis compared to the item level analysis (Table 2), thus strengthening the case for LD. In addition, the subtest specific coefficients A (amount of common variance among subtests), c (the variance that is unique to the subtests) and r (correlation between subtests, corrected for attenuation) did not provide unequivocal support for either unidimensionality or multidimensionality (Table 2). Applying the t-test procedure (Andrich & Marais, 2019; Hagell, 2014) by comparing person estimates derived from items 1, 2, 7, 8 vs. items 3, 4, 5, 6, resulted in significantly (P<0.05) different person locations for 2.64% and 1.01% of the persons according to the item level and subtest analyses, respectively.
Further implications of the observed LD were considered by conducting linear logit transformations (Ekstrand et al., 2022; Wright & Stone, 1979) based on item level and subtest analyses. In both cases, logits were transformed into two new ranges: the original raw total score range of 0-32 and a 0-100 range, which commonly is done in practice based on raw total scores (Jenkinson et al., 1997; Ruotolo et al., 2024). Results are displayed in Table 5. Two main points are notable. First, the transformed 0-100 logit-equivalent scores are markedly different from the common 0-100 transformation of raw total scores according to Jenkinson et al. (1997), which assumes that raw scores are linear. The observed differences illustrate that this is an incorrect assumption. Second, it is seen that 9 transformed score values in the 0-32 range differ when based on the subtest analysis compared to the item level analysis. For the commonly used 0-100 range, 24 transformed score values differ compared to the item level analysis.
Table 5.
Linear logit transformations based on item level and subtest analyses.
Item level analysis | Subtest analysis | ||||||||
Total score | Transformation range | Transformation range | |||||||
0-32 a | 0-100 b | Logits | 0-32 range | 0-100 range | Logits | 0-32 range | 0-100 range | ||
0 | 0 | -3.249 | 0 | 0 | -2.486 | 0 | 0 | ||
1 | 3 | -2.578 | 3 | 9 | -1.952 | 3 | 10 c | ||
2 | 6 | -2.131 | 5 | 16 | -1.608 | 5 | 16 | ||
3 | 9 | -1.834 | 6 | 20 | -1.387 | 7 c | 21 c | ||
4 | 13 | -1.607 | 7 | 23 | -1.219 | 8 c | 24 c | ||
5 | 16 | -1.421 | 8 | 26 | -1.082 | 8 | 26 | ||
6 | 19 | -1.262 | 9 | 28 | -0.964 | 9 | 29 c | ||
7 | 22 | -1.121 | 10 | 30 | -0.857 | 10 | 31 c | ||
8 | 25 | -0.993 | 10 | 32 | -0.759 | 10 | 32 | ||
9 | 28 | -0.874 | 11 | 33 | -0.667 | 11 | 34 c | ||
10 | 31 | -0.761 | 11 | 35 | -0.579 | 11 | 36 c | ||
11 | 34 | -0.653 | 12 | 36 | -0.494 | 12 | 37 c | ||
12 | 38 | -0.547 | 12 | 38 | -0.410 | 12 | 39 c | ||
13 | 41 | -0.444 | 13 | 39 | -0.326 | 13 | 41 c | ||
14 | 44 | -0.341 | 13 | 41 | -0.241 | 13 | 42 c | ||
15 | 47 | -0.237 | 14 | 42 | -0.155 | 14 | 44 c | ||
16 | 50 | -0.132 | 14 | 44 | -0.068 | 15 c | 45 c | ||
17 | 53 | -0.024 | 15 | 45 | 0.021 | 15 | 47 c | ||
18 | 56 | 0.087 | 15 | 47 | 0.113 | 16 c | 49 c | ||
19 | 59 | 0.204 | 16 | 49 | 0.208 | 16 | 51 c | ||
20 | 63 | 0.326 | 16 | 50 | 0.305 | 17 c | 52 c | ||
21 | 66 | 0.457 | 17 | 52 | 0.404 | 17 | 54 c | ||
22 | 69 | 0.596 | 17 | 54 | 0.507 | 18 c | 56 c | ||
23 | 72 | 0.747 | 18 | 56 | 0.613 | 19 c | 58 c | ||
24 | 75 | 0.910 | 19 | 58 | 0.725 | 19 | 60 c | ||
25 | 78 | 1.09 | 20 | 61 | 0.842 | 20 | 62 c | ||
26 | 81 | 1.289 | 20 | 64 | 0.97 | 21 c | 65 c | ||
27 | 84 | 1.513 | 21 | 67 | 1.114 | 22 c | 68 c | ||
28 | 88 | 1.772 | 23 | 71 | 1.281 | 23 | 71 | ||
29 | 91 | 2.081 | 24 | 75 | 1.488 | 24 | 75 | ||
30 | 94 | 2.476 | 26 | 80 | 1.766 | 26 | 80 | ||
31 | 97 | 3.044 | 28 | 88 | 2.191 | 28 | 88 | ||
32 | 100 | 3.864 | 32 | 100 | 2.844 | 32 | 100 | ||
a Raw summed total score.
b Transformed summed total score ((total score/32) x 100) (Jenkinson et al., 1997).
c Transformed score values differ compared to the item level analysis.
4. Discussion
The findings presented here demonstrate a number of issues regarding the measurement properties, and therefore the appropriateness of the PDQ-8. In accordance with previous RMT based evaluations of the PDQ-8 and its source instrument, the PDQ-39 (Franchignoni et al., 2008; Hagell & Nilsson, 2009; Hagell & Nygren, 2007; Hagell et al., 2003), this study found that the PDQ-8 exhibited compromised targeting by representing more severe health problems than that experienced by PwPD, signs of DIF by age and sex, and that its response categories do not work as expected. Some of the identified issues (e.g., targeting) could be related to the fact that only time 1 data were used, since later time points might this have reflected more health problems. However, similar observations were made from time 2, e.g., mean (SD) person location at time 2 was -1.2 (0.97) as compared to -1.3 (0.91) at time 1, and the presence of LD (data not shown). The observations reported here highlight the central role of LD in the measurement process and its potential clinical implications.
The presence of LD was indicated by item fit statistics which showed a pattern of negative fit residuals for all items but two (items 7 and 8). Similarly, item-restscore correlations were stronger than expected and outfit values were ≤1 in all instances but for items 7 and 8. Inspection of residual correlations initially suggested LD between three item pairs but after resolving these additional LD was revealed leading to the formation of two subtests with four items each. From a conceptual perspective these item groups make sense, as items 1, 2, 7 and 8 (subtest 1) may be considered “physical” and items 3-6 (subtest 2) can be considered “psychosocial”. However, whether the observed LD represents response or trait dependencies is unclear. First, although the two types of LD exhibit certain patterns under controlled circumstances, with empirical data where elements of both may occur it is virtually impossible to distinguish between the two (Marais & Andrich, 2008). Second, from a conceptual qualitative perspective, it is also unclear since both (or a combination) appear feasible. The diagnostic opportunities offered by the c, r and A indices following the formation of subtests also failed to provide unambiguous support for either. For example, the A value fell right in what has been suggested as an undetermined “grey area” between 0.7 and 0.9 (with <0.7 indicating multidimensionality and >0.9 indicating unidimensionality) (Tennant & Küçükdeveci, 2023). However, t-tests of person locations derived from the two independent item sets suggest that only a small proportion of these locations differed. Although not conclusive, this may suggest that the observed LD mainly involves response dependence.
The estimated reliability was suboptimal and dropped even further following the creation of subtests. This, as well as effects on person distribution and dispersion, is a well-known phenomenon in the presence of LD (Christensen et al., 2017; Marais, 2013; Marais & Andrich, 2008; Yen, 1993). It should be noted, however, that it is not reliability itself that is affected, but its estimation, and the lower (subtest based) estimate is the more realistic one since LD artificially increases reliability estimates. This has important implications since it relates to the assumed precision and ability of scores to separate people. One consequence of this is that artificially inflated reliability estimates may influence sample size estimations in statistical power analyses, meaning that intervention studies may have less power to detect changes and differences than expected (Fleiss, 1986). As such, this may contribute to negative study results, which in turn may have implications for clinical decision-making and patient care.
Raw total scores are not linear, which can have clinical implications, particularly among persons scoring towards the lower or upper end of the outcome continuum. This is obvious when comparing the total PDQ-8 scores with their linear logit transformations, particularly if the 0-100 range is used. In this regard, it was also seen that LD introduced an additional bias. When LD is addressed by the creation of subtests, several transformed score values change relative to those based on item level analysis, which may have additional clinical implications. Similarly to reliability, the subtest-based values are the more realistic ones. Although logits or their linear transformations are better estimates than raw scores, one should also be aware that their quality is directly related to the quality of the scale itself since the beneficial properties of the Rasch model are related to the extent to which data accord with model expectations (Andrich & Marais, 2019). The transformations reported here should therefore not be used as valid linear counterparts to the total PDQ-8 scores.
Taken together, the observations reported here do not support the validity of the PDQ-8 as a useful outcome measure in PD. This conclusion is in contrast with previous studies using traditional psychometric approaches. This is not surprising since RMT sets higher standards and is more powerful in revealing measurement disturbances than traditional approaches are (Hagell, 2019; Hobart & Cano, 2009). The PDQ-8 was developed using a data driven traditional psychometric approach and, importantly, without any definition of its target variable (Peto et al., 1995). This means that its content was determined based on distribution dependent sample statistics and that it is virtually impossible to make reasonable judgements regarding its validity from a conceptual point of view. Given the findings reported here it is tempting to conclude that the PDQ-8 is not a measure or a scale at all, but merely a collection of single items. To the extent that these items are considered to provide important clinical information, the PDQ-8 may well be of clinical value, but not as an outcome measure or through its total score, but rather as a means of communicating qualitative item level information. Further adding to this is the observation that several of its items, when treated as a scale, essentially represent the same levels.
Historically, LD appears to have been a relatively forgotten aspect in health outcomes measurement. The results presented here are in line with and confirms previous experiences (see, e.g., Caselli et al., 2023) pointing to the central role of LD and the importance of identifying and resolving LD before drawing further conclusions on the measurement properties of rating scales. In the case of the PDQ-8, resolving LD improved several aspects of its measurement properties but revealed important shortcomings. Together with unclear construct validity, this argues against the appropriateness of the PDQ-8 as an outcome measure.
Acknowledgements
The author wants to thank the Swedish Neuro Registries/Parkinson’s disease (https://neuroreg.se) and Drs. Oudin Åström and Odin for valuable input and discussions.
Funding details and disclosure statement
This work was supported by Kristianstad University, Kristianstad, Sweden. The author declares no conflict of interest.
Data Availability Statement
The data are not publicly available and cannot be shared due to legal and ethical restrictions.
How to Cite
Hagell, p. (2026). Local dependence in health outcome measurement: The case of the 8-item Parkinson’s disease questionnaire (PDQ-8). Educational Methods & Psychometrics, 4 (SAMC 2024 Special Issue): 27.
References
Andrich, D. (1985). A latent trait model for items with response dependencies: Implications for test construction and analysis. In S. E. Embretson (Ed.), Test design: Developments in psychology and psychometrics (pp. 245-275). Academic Press, Inc. http://dx.doi.org/10.1016/B978-0-12-238180-5.50013-6
Andrich, D. (2011). Rating scales and Rasch measurement. Expert Review of Pharmacoeconomics & Outcomes Research, 11(5), 571-585. https://doi.org/10.1586/erp.11.59
Andrich, D., & Marais, I. (2019). A course in Rasch measurement theory: measuring in the educational, social and health sciences. Springer. http://dx.doi.org/10.1007/978-981-13-7496-8
Astrom, D. O., Simonsen, J., Raket, L. L., Sgarbi, S., Hellsten, J., Hagell, P., Norlin, J. M., Kellerborg, K., Martinez-Martin, P., & Odin, P. (2022). High risk of developing dementia in Parkinson's disease: a Swedish registry-based study. Scientific Reports, 12(1), 16759. https://doi.org/10.1038/s41598-022-21093-8
Berardi, A., Regoli, E., Tofani, M., Valente, D., Fabbrini, G., Fabbrini, A., Ruggieri, M., Panuccio, F., & Galeoto, G. (2021). Tools to assess the quality of life in patients with Parkinson's disease: a systematic review. Expert Review of Pharmacoeconomics & Outcomes Research, 21(1), 55-68. https://doi.org/10.1080/14737167.2021.1841638
Brodersen, J., Meads, D., Kreiner, S., Thorsen, H., Doward, L., & McKenna, S. (2007). Methodological aspects of differential item functioning in the Rasch model. Journal of Medical Economics, 10(3), 309-324. https://doi.org/10.3111/13696990701557048
Caselli, S., Sabattini, L., Cattaneo, D., Jonsdottir, J., Brichetto, G., Pozzi, S., Lugaresi, A., & La Porta, F. (2023). When 'good' is not good enough: a retrospective Rasch analysis study of the Berg Balance Scale for persons with Multiple Sclerosis. Frontiers in Neurology, 14, 1171163. https://doi.org/10.3389/fneur.2023.1171163
Christensen, K. B., & Kreiner, S. (2013). Item fit statistics. In K. B. Christensen, S. Kreiner, & M. Mesbah (Eds.), Rasch models in health (pp. 83-103). John Wiley & Sons, Inc. https://doi.org/10.1002/9781118574454.ch5
Christensen, K. B., Makransky, G., & Horton, M. (2017). Critical Values for Yen’s Q3: Identification of Local Dependence in the Rasch Model Using Residual Correlations. Applied Psychological Measurement, 41(3), 178-194. https://doi.org/10.1177/0146621616677520
de Lau, L. M., & Breteler, M. M. (2006). Epidemiology of Parkinson's disease. Lancet Neurology, 5(6), 525-535. https://doi.org/10.1016/s1474-4422(06)70471-9
De Roos, P., Bloem, B. R., Kelley, T. A., Antonini, A., Dodel, R., Hagell, P., Marras, C., Martinez-Martin, P., Mehta, S., Odin, P., Chaudhuri, A., Weintraub, D., Wilson, B., & Uitt, i. R. (2017). A Consensus Set of Outcomes for Parkinson's Disease from the International Consortium for Health Outcomes Measurement. Journal of Parkinson's Disease, 3(7), 533-534. https://doi.org/10.3233/JPD-161055
Ekstrand, J., Westergren, A., Arestedt, K., Hellstrom, A., & Hagell, P. (2022). Transformation of Rasch model logits for enhanced interpretability. BMC Medical Research Methodology, 22(1), 332. https://doi.org/10.1186/s12874-022-01816-1
Fahn, S., Elton, R. L., & members of the UPDRS development committee. (1987). Unified Parkinson’s Disease Rating Scale. In S. Fahn, C. D. Marsden, D. B. Calne, & M. Goldstein (Eds.), Recent Developments in Parkinson’s Disease, Vol. 2 (pp. 153-163). MacMillan Healthcare Information.
Fleiss, J. L. (1986). The design and analysis of clinical experiments. Wiley.
Franchignoni, F., Giordano, A., & Ferriero, G. (2008). Rasch analysis of the short form 8-item Parkinson's Disease Questionnaire (PDQ-8). Quality of Life Research, 17, 541-548. http://dx.doi.org/10.1007/s11136-008-9341-6
Haahr, A., Groos, H., & Sorensen, D. (2021). 'Striving for normality' when coping with Parkinson's disease in everyday life: A metasynthesis. International Journal of Nursing Studies, 118, 103923. https://doi.org/10.1016/j.ijnurstu.2021.103923
Haahr, A., Kirkevold, M., Hall, E. O., & Ostergaard, K. (2011). Living with advanced Parkinson's disease: a constant struggle with unpredictability. Journal of Advanced Nursing, 67(2), 408-417. https://doi.org/10.1111/j.1365-2648.2010.05459.x
Hagell, P. (2014). Testing Rating Scale Unidimensionality Using the Principal Component Analysis (PCA)/t-Test Protocol with the Rasch Model: The Primacy of Theory over Statistics. Open Journal of Statistics, 4, 456-465. https://doi.org/10.4236/ojs.2014.46044
Hagell, P. (2019). Measuring activities of daily living in Parkinson’s disease: On a road to nowhere and back again? Measurement, 132, 109-124. https://doi.org/10.1016/j.measurement.2018.09.050
Hagell, P., & Nilsson, M. H. (2009). The 39-Item Parkinson's Disease Questionnaire (PDQ-39): Is it a Unidimensional Construct? Therapeutic Advances in Neurological Disorders, 2(4), 205-214. https://doi.org/10.1177/1756285609103726
Hagell, P., & Nygren, C. (2007). The 39 item Parkinson's disease questionnaire (PDQ-39) revisited: implications for evidence based medicine. Journal of Neurology Neurosurgery & Psychiatry, 78(11), 1191-1198. https://doi.org/10.1136/jnnp.2006.111161
Hagell, P., Whalley, D., McKenna, S. P., & Lindvall, O. (2003). Health status measurement in Parkinson's disease: validity of the PDQ-39 and Nottingham Health Profile. Movemant Disorders, 18(7), 773-783. https://doi.org/10.1002/mds.10438
Hagquist, C., & Andrich, D. (2017). Recent advances in analysis of differential item functioning in health research using the Rasch model. Health and Quality of Life Outcomes, 15(1), 181. https://doi.org/10.1186/s12955-017-0755-0
Hobart, J., & Cano, S. (2009). Improving the evaluation of therapeutic interventions in multiple sclerosis: the role of new psychometric methods. Health Technology Assessment, 13(12), iii, ix-x, 1-177. http://dx.doi.org/10.3310/hta13120
Hoehn, M. M., & Yahr, M. D. (1967). Parkinsonism: onset, progression and mortality. Neurology, 17(5), 427-442. http://dx.doi.org/10.1212/WNL.17.5.427
Jankovic, J. (2008). Parkinson's disease: clinical features and diagnosis. Journal of Neurology Neurosurgery & Psychiatry, 79(4), 368-376. http://dx.doi.org/10.1136/jnnp.2007.131045
Jenkinson, C., Fitzpatrick, R., Peto, V., Greenhall, R., & Hyman, N. (1997). The PDQ-8: Development and validation of a short-form Parkinson’s disease questionnaire. Psychology & Health, 12(6), 805-814. http://dx.doi.org/10.1080/08870449708406741
Johansson, M. (2025). easyRasch: Psychometric analysis in r with rasch measurement theory. In https://github.com/pgmj/easyRasch
Kreiner, S. (2011). A note on item–restscore association in Rasch models. Applied Psychological Measurement, 35(7), 557-561. http://dx.doi.org/10.1177/0146621611410227
Mair, P., Rusch, T., Hatzinger, R., Maier, M. J., & Debelak, R. (2024). eRm: Extended Rasch Modeling. In (Version R package version 1.0-6) https://cran.r-project.org/package=eRm
Marais, I. (2013). Local dependence. In K. B. Christensen, S. Kreiner, & M. Mesbah (Eds.), Rasch models in health (pp. 111-130). John Wiley & Sons, Inc. http://dx.doi.org/10.1002/9781118574454.ch7
Marais, I., & Andrich, D. (2008). Formalizing dimension and response violations of local independence in the unidimensional Rasch model. Journal of Applied Measurement, 9(3), 200-215. http://www.ncbi.nlm.nih.gov/pubmed/18753691
Martinez-Martin, P., Jeukens-Visser, M., Lyons, K. E., Rodriguez-Blazquez, C., Selai, C., Siderowf, A., Welsh, M., Poewe, W., Rascol, O., Sampaio, C., Stebbins, G. T., Goetz, C. G., & Schrag, A. (2011). Health-related quality-of-life scales in Parkinson's disease: critique and recommendations. Movement Disorders, 26(13), 2371-2380. https://doi.org/10.1002/mds.23834
Müller, M. (2020). Item fit statistics for Rasch analysis: can we trust them? Journal of Statistical Distributions and Applications, 7, 1-12. http://dx.doi.org/10.1186/s40488-020-00108-7
Müller, M. (2022). iarm: Item Analysis in Rasch Models. In (Version R package version 0.4.3) https://cran.r-project.org/package=iarm
Peto, V., Jenkinson, C., Fitzpatrick, R., & Greenhall, R. (1995). The development and validation of a short measure of functioning and well being for individuals with Parkinson's disease. Quality of Life Research, 4(3), 241-248. http://dx.doi.org/10.1007/BF02260863
Rasch, G. (1960). Probabilistic models for some intelligence and attainment tests. Danmarks Paedagogiske Institut.
Ruotolo, I., Sellitto, G., Berardi, A., Simeon, R., Panuccio, F., Amadio, E., Ugolini, A., Fabbrini, G., & Galeoto, G. (2024). Psychometric properties of the Parkinson's disease Questionnaire-39 and its short form Parkinson's disease Questionnaire-8: A systematic review and meta-analysis. Journal of Clinical Neuroscience, 123, 100-117. https://doi.org/10.1016/j.jocn.2024.03.032
Schapira, A. H. V., Chaudhuri, K. R., & Jenner, P. (2017). Non-motor features of Parkinson disease. Nature Reviews Neuroscience, 18(7), 435-450. https://doi.org/10.1038/nrn.2017.62
Sjodahl Hammarlund, C., Westergren, A., Astrom, I., Edberg, A. K., & Hagell, P. (2018). The Impact of Living with Parkinson's Disease: Balancing within a Web of Needs and Demands. Parkinsons Disease, 2018, 4598651. https://doi.org/10.1155/2018/4598651
Tennant, A., & Küçükdeveci, A. A. (2023). Application of the Rasch measurement model in rehabilitation research and practice: early developments, current practice, and future challenges. Frontiers in Rehabilitation Sciences, 4, 1208670. http://dx.doi.org/10.3389/fresc.2023.1208670
Wright, B. D., & Masters, G. N. (1982). Rating scale analysis. MESA Press. https://www.rasch.org
Wright, B. D., & Stone, M. H. (1979). Best test design. MESA Press. https://www.rasch.org
Yen, W. M. (1993). Scaling Performance Assessments: Strategies for Managing Local Item Dependence. Journal of Educational Measurement, 30(3), 187-213. https://doi.org/10.1111/j.1745-3984.1993.tb00423.x
Manuscript Received: 04 MAR 2025
Final Version Received: 18 JAN 2026
Published Online Date: 15 FEB 2026
PUBLISHED
ISSUE
