Full Html
What Aberrant Responses in a National Mathematics Examination Reveal About Student Performance
Full Html
1. Introduction
Aberrant responses refer to answer patterns that deviate from those predicted by an underlying scoring model, such as the Rasch model or other item response theory frameworks (Meijer, 1996; Tendeiro & Meijer, 2012). In standardized assessments, such deviations may arise from disengagement, misunderstanding, guessing, or strategic responding (Meijer, Niessen, & Tendeiro, 2016). Traditionally, aberrant patterns have been treated as threats to validity and reliability, often leading to their exclusion from analysis (Keeves & Masters, 1999; Conijn, Emons, & Sijtsma, 2014). However, recent research suggests that these patterns may also carry diagnostic information about students’ learning processes and instructional contexts.
Person-fit statistics have increasingly been used to move beyond viewing aberrant responses as mere noise. Meijer and Tendeiro (2014) demonstrated that inconsistent response patterns in high-stakes settings may reflect contextual factors such as language proficiency rather than misconduct. Cui and Roberts (2013) showed that person-fit indicators can reveal discrepancies between cognitive models of mastery and observed performance, highlighting conceptual misunderstandings. Walker et al. (2018) further emphasized that combining person-
Correspondence should be made to Marta Mikīte, University of Latvia, Faculty of Sciences and Technology, Interdisciplinary Centre of Educational Innovations. E-mail: marta.mikite@lu.lv
© 2026 The Authors. This is an open access article under the CC BY 4.0 license (https://creativecommons.org/licenses/by/4.0/)
fit statistics with person response functions enables more refined interpretations of individual performance.
Although these studies underscore the interpretive potential of aberrant responses, most rely primarily on quantitative modelling. However, few studies have systematically combined Rasch-based residual diagnostics with structured qualitative item analysis in order to interpret response deviations in relation to instructional alignment. Integrating person-fit statistics with structured qualitative evaluation of item characteristics may therefore provide a more comprehensive account of how unexpected response patterns relate to instructional practices (Bikner-Ahsbahs & Prediger, 2014; Radford, 2008 In this study, qualitative analysis refers specifically to structured expert evaluation of item functionality, repetition, and cognitive demand, which are systematically linked to Rasch-based person-fit indicators.
We apply this integrated framework to the Latvian national Grade 9 mathematics examination. We interpret aberrant response patterns through the lens of the washback effect—the tendency of teachers and students to align classroom practices with high-stakes examination demands (Alderson & Wall, 1993). As examinations increasingly shape instructional priorities (Cheng & Curtis, 2004), washback may take both beneficial and detrimental forms (Buck, 1988). Positive washback occurs when assessment tasks promote meaningful engagement with subject content (Taylor, 2005; Furaidah, Saukah, & Widiati, 2014). Conversely, when examinations emphasize predictable or procedural formats, instruction may narrow toward repetitive practice, a phenomenon often described as drilling (Smith, 1991; Cheng & Curtis, 2004; Xie, 2015).
In mathematics education, drilling-oriented instruction has been associated with weaker long-term achievement and limited transfer of knowledge (Im et al., 2020). Analyses of European lower secondary exit examinations indicate that mathematics assessments frequently target a restricted range of competencies and rely heavily on low-cognitive-demand tasks (Drüke-Noe & Kühn, 2017). Evidence from Latvia suggests similar tendencies (Mikite et al., 2022). Such assessment structures may contribute to systematic instructional alignment and may be reflected in the distribution of unexpected response patterns detectable through person-fit analysis.
This study pursues two interconnected aims. First, it proposes a methodological framework that integrates Rasch-based person-fit statistics with structured qualitative evaluation of item characteristics to interpret aberrant response patterns beyond their traditional role as indicators of measurement error. This framework is operationalized through three indices—Instability, Understanding, and Drill—that link unexpected responses to item functionality, cognitive demand, and repetition. Second, we apply this framework to examine whether systematic differences in these indices across performance groups and school types are consistent with patterns expected under washback effects. Rather than treating aberrant responses solely as threats to validity, we explore their potential as indicators of instructional alignment and exam-oriented preparation.
2. Method
Data
The dataset comprised results from the Latvian national Grade 9 mathematics examination, taken by 17962 students. The paper-based examination consisted of 51 items, including both multiple-choice and structured-response tasks. As a nationwide standardized assessment administered to all students at the end of lower secondary education, the exam was centrally graded. Examiners evaluated responses without information about the students’ school affiliation, thereby reducing the likelihood of systematic grading bias, although minor scoring inaccuracies cannot be entirely excluded.
For subsequent analyses, item and person parameters were estimated within the Rasch measurement framework. Because the examination included both dichotomous and polytomous items, a Rasch family modelling approach was applied. Dichotomous items were parameterized using the Rasch dichotomous model, whereas polytomous items were estimated using the Partial Credit Model. Parameters were estimated using Joint Maximum Likelihood Estimation (JMLE) implemented in Winsteps (Version 4.6.2, Winsteps.com, 2024). Person ability estimates were expressed in logits and served as the basis for subsequent person-fit and residual analyses.
Data compilation and procedure
Conceptually, the framework distinguishes between (a) item-level structural characteristics (functionality, cognitive demand, repetition), (b) student-level deviation patterns derived from Rasch residuals, and (c) composite indices integrating both sources of information to describe response structure. Table 1 summarizes the variables and indices comprising this analytical framework.
Table 1.
Structure of Variables and Indices in the Analytical Framework
Level | Variable | Symbol | Scale | Analytical Role |
Item-level | Item functionality | fᵢ | 0–2 | Weighting factor based on INFIT/OUTFIT |
Item-level | Cognitive demand | uᵢ | 0–2 | Weights conceptual task requirements |
Item-level | Task repetition (drill) | dᵢ | 0–2 | Weights structural similarity across years |
Student-level | Residual deviation | rᵢ | −2 to 2 | Direction and magnitude of unexpected response |
Composite | Instability Index | I | 0–1 | Magnitude of weighted deviation |
Composite | Understanding Index | U | −1 to 1 | Directional deviation weighted by cognitive demand |
Composite | Drill Index | D | 0–1 | Magnitude of deviation in repetitive tasks |
As shown in Table 1, the analytical framework integrates three item-level variables (functionality, cognitive demand, and task repetition) with student-level residual deviations derived from the Rasch model. These components are combined to construct the Instability (I), Understanding (U), and Drill (D) indices, which operationalize distinct dimensions of response structure. The following section details their operational definitions and computational procedures.
Item functionality (fᵢ) was evaluated using INFIT and OUTFIT mean square (MNSQ) statistics within the Rasch measurement framework. Following widely accepted guidelines in Rasch measurement (e.g., Linacre, 2002; Bond & Fox, 2015), values between 0.8 and 1.2 were considered indicative of adequate model fit. Values exceeding 1.2 were interpreted as underfit, suggesting increased unpredictability relative to model expectations, whereas values below 0.8 were interpreted more cautiously, as overfit may indicate redundancy rather than substantive measurement distortion. Given the large sample size, standardized Z-fit statistics were not used for decision-making, as they are known to become overly sensitive in large datasets and may flag trivial deviations as statistically significant (Linacre, 2002).
Importantly, item fit statistics were not employed as exclusion criteria. Instead, functionality served as a weighting factor in the construction of person-level indices. Items demonstrating strong conformity to the Rasch model were treated as more stable indicators of student response behavior, whereas items exhibiting substantial underfit were down-weighted to avoid over-interpreting patterns derived from potentially unstable measurement conditions. This approach aligns with recommendations that fit statistics should support substantive interpretation rather than operate as mechanical filters for data removal (Smith, 2000; Tennant & Pallant, 2006).
In addition to statistical evaluation, all items were independently reviewed by multiple subject-matter experts in mathematics education. The expert review focused on three predefined dimensions: structural similarity of items across examination years (drill), the level of cognitive demand (procedural versus conceptual), and alignment with curriculum intentions. Ratings were conducted independently and subsequently discussed until consensus was achieved. The integration of Rasch-based fit diagnostics with structured expert evaluation ensured that item functionality was interpreted not solely in statistical terms but also in relation to pedagogical meaning. This combined approach strengthened the content-related and construct-related validity of the indices derived from these classifications.
A student-level variable captured item-level aberrant responses derived from the Rasch residual output (Winsteps Table 40). Table 40 provides a person-by-item residual map indicating discrepancies between observed responses and model-expected outcomes based on estimated person ability and item difficulty parameters. For each student–item interaction, the Rasch model generates an expected probability of success. Deviations between observed and expected responses are displayed in Table 40 as standardized residual classifications. Unexpectedly high responses (correct answers to items that are relatively difficult given the student’s estimated ability) and unexpectedly low responses (incorrect answers to relatively easy items) are flagged as departures from model expectations. Importantly, this output does not modify raw scores but serves as a diagnostic representation of response consistency relative to the Rasch model.
To systematically extract and structure these residual classifications, the Table 40 output was first exported from Winsteps as a plain-text file and then converted into a tabular dataset. Using automated regular-expression parsing, student-level blocks and the relevant item-level residual markers were extracted, reorganized into a person-by-item matrix, and exported to Excel for further processing and readability. This structured dataset was then used to identify and code aberrant events for each student–item interaction. Aberrant events were coded according to Winsteps residual markers as follows: −2 for very unexpected lower performance, −1 for unexpected lower performance, 1 for unexpected higher performance, and 2 for very unexpected higher performance. Responses consistent with model expectations were not assigned a value and were treated as baseline (non-aberrant) cases rather than as a separate zero category.
Figure 1 presents an excerpt of Table 40 for a single student, illustrating item-specific deviations from model expectations. For example, the response to item 6_1 is classified as −2, indicating substantially lower-than-expected performance, whereas item 17 is classified as 2, reflecting substantially higher-than-expected performance. Similarly, item 20 is coded as −1 and item 26_2 as 1, demonstrating the presence of both negative and positive deviations within the same response pattern. The dataset supporting this analysis has been deposited in Zenodo and can be accessed via https://doi.org/10.5281/zenodo.15007893.
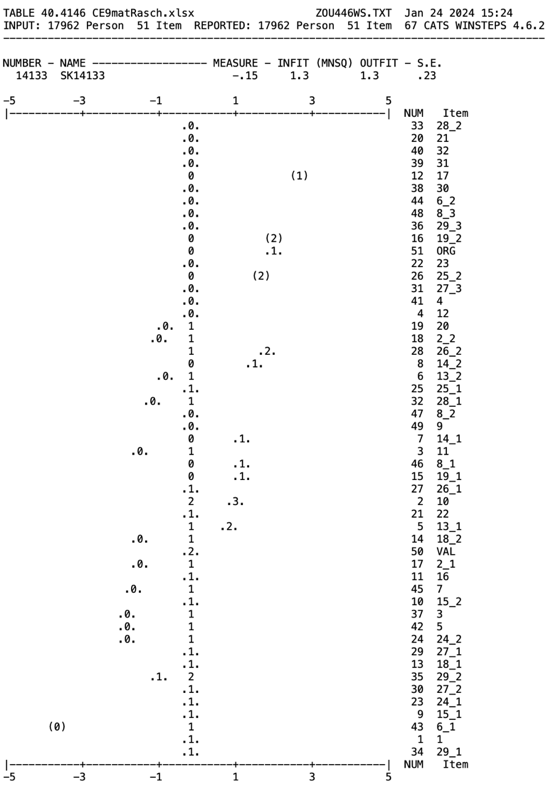
Figure 1. Excerpt from Winsteps Table 40 displaying the person-by-item residual map for a single student
.
Dots (.) indicate responses consistent with model expectations. The symbol “1” indicates the model-expected response category, whereas “.1.” denotes an observed response matching that expectation. Values shown in parentheses (e.g., “(1)”) indicate observed responses flagged as very unexpected relative to the Rasch model.
These student-level and item-level variables were subsequently combined to construct indices intended to capture systematic patterns of response instability, conceptual understanding, and drill-related performance.
Data analysis
Based on the Rasch Wright map, students were grouped into four performance levels according to their estimated ability measures. The central reference line corresponds to the Rasch logit scale origin (0 logits), which represents the average item difficulty in the calibrated model rather than a statistical median of the sample. The remaining boundaries between performance levels were determined through qualitative examination of task characteristics, identifying meaningful thresholds that distinguish lower, average, and higher levels of conceptual and procedural demand.
Using the previously defined item-level and student-level variables, three composite indices were calculated for each student: (1) Instability index (I), (2) Understanding index (U), and (3) Drill index (D). These indices were designed to capture structured patterns in aberrant response behavior rather than isolated deviations.
In constructing the indices, aberrant responses were weighted by item functionality (fᵢ). This weighting reflects the assumption that deviations observed in well-functioning items—those that conform closely to Rasch model expectations—carry greater interpretive significance than deviations observed in items exhibiting substantial misfit. Thus, item functionality operates as a stabilizing factor in the index calculation rather than as a determinant of correctness or item quality.
The Instability Index (I) quantifies the overall magnitude of a student’s aberrant responses across the test. While the Rasch person OUTFIT statistic may be influenced by either a small number of extreme deviations or a broader pattern of inconsistencies, the Instability Index was designed to capture the cumulative structure of item-level deviations.
The index is defined as:
![]()
where ![]() – item,
– item, ![]() – functionality (0,1,2),
– functionality (0,1,2), ![]() – value of aberrant response (-2;-1;1;2).
– value of aberrant response (-2;-1;1;2).
The numerator represents the weighted sum of the absolute magnitudes of aberrant responses, ensuring that both unexpectedly low and unexpectedly high performances contribute equally to instability. The denominator corresponds to the maximum possible weighted deviation (i.e., if all items exhibited the highest level of aberration), thereby normalizing the index to the interval [0, 1].
Consequently, ????=0 indicates complete conformity to model expectations, whereas values approaching 1 reflect a high concentration of substantial deviations across well-functioning items. Because residuals in the Rasch model are computed relative to each student’s estimated ability, the indices capture structured deviations from model-expected performance rather than differences in overall achievement level. Item functionality operates as a weighting factor, so deviations in statistically stable items contribute more strongly to the index than deviations in items exhibiting misfit.
The Understanding Index (U) was designed to capture directional patterns of aberrant responses in relation to cognitively demanding tasks. Unlike the Instability Index, which measures the overall magnitude of deviations, the Understanding Index preserves the sign of the aberrant response to distinguish between unexpectedly low and unexpectedly high performance.
The index is defined as:
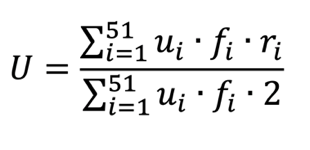
where ![]() – item,
– item, ![]() – the extent to which the task has high cognitive demands (0,1,2),
– the extent to which the task has high cognitive demands (0,1,2), ![]() – functionality (0,1,2),
– functionality (0,1,2), ![]() – value of aberrant response (-2;-1; 1;2).
– value of aberrant response (-2;-1; 1;2).
The numerator represents the weighted sum of directional aberrant responses, giving greater influence on deviations occurring in tasks with higher cognitive demand and stronger model conformity. The denominator corresponds to the maximum possible weighted deviation, thereby normalizing the index to the interval [−1, 1].
A negative value of U indicates that a student performs below model expectations on cognitively demanding tasks, suggesting potential difficulties in conceptual reasoning. Conversely, a positive value indicates relatively stronger-than-expected performance in high-demand tasks, which may reflect deeper understanding not fully captured by overall ability estimates.
The Drill Index (D) quantifies the magnitude of aberrant responses in tasks characterized by structural repetition across examination years. In constructing this index, greater weight is assigned to items identified as drill-type tasks.
The index is defined as:
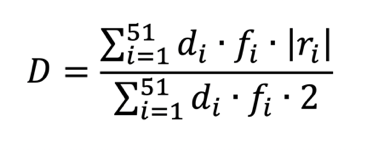
where ![]() – item,
– item, ![]() – the extent to which such items are repeated year after year - drill exercises (0,1,2),
– the extent to which such items are repeated year after year - drill exercises (0,1,2), ![]() – functionality (0,1,2),
– functionality (0,1,2), ![]() – value of aberrant response (-2;-1;1;2).
– value of aberrant response (-2;-1;1;2).
The numerator represents the weighted sum of the absolute magnitudes of aberrant responses occurring in drill-type items. The denominator corresponds to the maximum possible weighted deviation, thereby normalizing the index to the interval [0, 1].
The use of the absolute value reflects the fact that the index is intended to capture the intensity of deviation in highly repetitive and predictable task formats, irrespective of direction. In drill-type contexts—where performance is typically expected to be stable—both unexpectedly low and unexpectedly high outcomes represent departures from model-based expectations. By using absolute values, the index quantifies the overall extent of instability within repetitive task structures rather than privileging either underperformance or overperformance.
Within each performance group (with the exception of the low-performance group), students were further divided into quartiles based on the distribution of index values within that group. Quartile-based categorization was used to facilitate interpretation and to identify relative differences in instability, understanding, and drill-related patterns among students with comparable overall ability levels. The low-performance group was not subdivided due to limited variability and interpretative constraints.
Schools were categorized into six institutional types: primary schools, secondary schools, evening or distance-learning schools, state gymnasiums, vocational schools, and special education schools. Index distributions were subsequently compared across these school types to examine structural differences in response patterns.
3. Results
Using the Rasch Wright map (Figure 2), students were categorized into four performance levels according to their estimated ability measures expressed in logits. The zero point on the scale represents the average item difficulty in the calibrated model.
Boundaries between performance levels were established by examining the distribution of item difficulties in conjunction with expert-based qualitative analysis of task content. Specifically, threshold regions were identified where item demands shifted from predominantly procedural tasks to tasks requiring higher levels of conceptual reasoning. These boundaries were defined prior to index comparisons to ensure interpretive consistency.
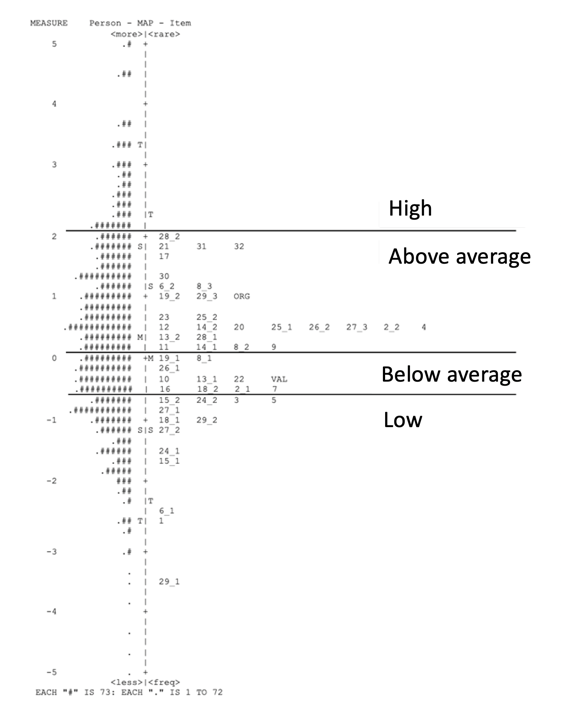
Figure 2. Wright map illustrating performance-level thresholds
Table 2 presents the distribution of students across the four Rasch-based performance levels. Of the total sample (N = 17,962), 7,602 students (42%) were classified in the above-average level, 4,785 (27%) in the low-performance level, 3,011 (17%) in the high-performance level, and 2,564 (14%) in the below-average level.
The distribution indicates that the largest proportion of students is located slightly above the average item difficulty level, with smaller proportions occupying the extreme ends of the scale.
Table 2.
Number of students in performance levels
Performance level | Number of students |
High | 3011 |
Above average | 7602 |
Below average | 2564 |
Low | 4785 |
Descriptive statistics of the three indices are presented in Table 3. Although all indices are normalized to a bounded scale, they reflect distinct constructs—instability, cognitively weighted deviation, and drill-weighted deviation—and are therefore not directly comparable in substantive terms.
Table 3.
Descriptive statistics of misfit indices
Index | Mean (SD) |
I - Instability | 0.147 (0.063) |
U - Understanding | -0.010 (0.061) |
D - Drill | 0.142 (0.072) |
Table 4 presents the results of one-way ANOVA examining differences in index values across performance groups. Significant differences were observed for all three indices (p < .001). Given the large sample size, statistical significance was expected; however, the pattern of means indicates systematic variation in index values across ability levels. Instability (I) shows lower mean values among high-performing students and higher values among above-average and below-average groups. The Understanding Index (U) shifts from negative values in higher performance groups to positive values in lower groups, indicating directional differences in deviations across cognitive-demand tasks. The Drill Index (D) increases from the high-performance group toward the below-average group, with slightly lower values again in the lowest-performing group.
Because index values vary systematically across performance levels, subsequent analyses examine patterns within performance groups to avoid confounding ability differences with structural response characteristics.
Table 4.
Results of ANOVA. Comparison of normalized misfit indices between ability level groups
I - Instability | U - Understanding | D - Drill | ||||
Ability level | Mean (SD) | F | Mean (SD) | F | Mean (SD) | F |
High | 0.071 (0.040) | 5491.543 | -0.052 (0.043) | 5531.922 | 0.053 (0.041) | 4784.346 |
Above average | 0.182 (0.048) |
| -0.040 (0.048) |
| 0.172 (0.056) |
|
Below average | 0.187 (0.045) |
| 0.008 (0.046) |
| 0.198 (0.053) |
|
Low | 0.118 (0.047) |
| 0.054 (0.038) |
| 0.120 (0.056) |
|
Note. One-way ANOVA revealed significant differences between performance levels for all indices: Instability, F(3, 17958) = 5491.54, p < .001; Understanding, F(3, 17958) = 5531.92, p < .001; Drill, F(3, 17958) = 4784.35, p < .001.
Given the systematic differences observed between performance levels, subsequent analyses were conducted separately within each group to avoid confounding ability differences with structural response patterns. Table 5 presents quartile threshold values for each index within the high, above average, and below average performance groups. The low performance group was not subdivided into quartiles due to limited variability in index distributions and the concentration of ability estimates at the lower end of the scale.
Within-group quartile thresholds were used to distinguish relatively higher and lower index values among students with comparable overall ability levels. These quartile boundaries represent relative distribution-based thresholds within each performance group and should not be interpreted as absolute or externally validated classification criteria.
Table 5.
Quartile Threshold Values of Indices Within Performance Groups
Performance level | Below Average | High | Above Average | ||||||||||||||||
Index | U | D | I | U | D | I | U | D | I | ||||||||||
Minimum | -0.158 | 0.060 | 0.068 | -0.217 | 0.000 | 0.000 | -0.300 | 0.011 | 0.027 |
| |||||||||
Maximum | 0.192 | 0.413 | 0.385 | 0.083 | 0.364 | 0.284 | 0.150 | 0.391 | 0.358 |
| |||||||||
25th percentile | -0.025 | 0.163 | 0.155 | -0.083 | 0.022 | 0.041 | -0.075 | 0.136 | 0.149 |
| |||||||||
50th percentile | 0.008 | 0.196 | 0.182 | -0.050 | 0.049 | 0.068 | -0.042 | 0.174 | 0.182 |
| |||||||||
75th percentile | 0.042 | 0.228 | 0.216 | -0.017 | 0.076 | 0.101 | -0.008 | 0.212 | 0.216 |
| |||||||||
Note. Quartile thresholds are calculated separately within each performance group. Values represent distribution-based cut points and should not be interpreted as absolute classification criteria.
Table 6 presents index values for all students within one selected school, ensuring that each performance group contains at least two students. Analyses are conducted within performance groups to control for overall ability differences.
Within the high-performance group, the mean Understanding Index (U = −0.083) falls in the second quartile, the mean Drill Index (D = 0.092) in the fourth quartile, and the mean Instability Index (I = 0.095) in the third quartile. Individual students within this group display heterogeneous index profiles. For example, student sk2189 shows higher instability (fourth quartile) and lower Understanding (first quartile) compared to sk2194, whose indices are more centrally distributed. These differences illustrate variation in response patterns despite comparable overall ability levels.
In the above-average group, the mean values indicate higher Instability and Drill indices relative to the high-performance group. Individual profiles again vary: some students display relatively higher Understanding values, whereas others show stronger Drill-weighted deviations. These contrasts demonstrate that students with similar ability levels may exhibit distinct structural response patterns.
A similar pattern of within-group variability is observed in the below-average group. Index combinations differ across students, with some showing higher Drill-weighted deviations and others exhibiting more pronounced directional differences in Understanding. These findings illustrate heterogeneity in response structure within ability groups. Although certain index combinations may be consistent with patterns associated with exam-oriented preparation, the observed profiles do not allow for definitive causal conclusions regarding instructional practices.
Table 6.
Within-Group Index Profiles for Students in One Selected School (School 256)
Student (Misfit) | U (Quartile) | D (Quartile) | I (Quartile) |
High performance level (Mean) | -0,083 (2) | 0,092 (4) | 0,095 (3) |
sk2189 (1) | -0,100 (1) | 0,152 (4) | 0,135 (4) |
sk2194 (1) | -0,067 (2) | 0,033 (2) | 0,054 (2) |
Above Average performance level (Mean) | -0,053 (2) | 0,190 (3) | 0,207 (4) |
sk2182 (1) | -0,008 (4) | 0,212 (4) | 0,189 (3) |
sk2188 (0) | -0,033 (2) | 0,223 (4) | 0,243 (4) |
sk2190 (1) | -0,117 (3) | 0,136 (2) | 0,189 (3) |
Below Average | 0,033 (3) | 0,264 (3) | 0,257 (4) |
sk2185 (0) | -0,033 (1) | 0,261 (4) | 0,236 (4) |
sk2187 (0) | 0,125 (4) | 0,288 (4) | 0,291 (4) |
sk2191 (0) | 0,067 (4) | 0,266 (4) | 0,257 (4) |
sk2196 (1) | -0,017 (2) | 0,332 (3) | 0,311 (4) |
sk2197 (0) | 0,025 (3) | 0,174 (2) | 0,189 (3) |
Low performance level (Mean) | 0,078 (4) | 0,103 (3) | 0,116 (3) |
sk2183 (1) | 0,150 (4) | 0,109 (3) | 0,149 (4) |
sk2184 (0) | 0,100 (4) | 0,092 (2) | 0,128 (3) |
sk2186 (0) | 0,117 (4) | 0,098 (2) | 0,108 (2) |
sk2192 (0) | 0,033 (2) | 0,022 (1) | 0,027 (3) |
sk2193 (0) | 0,050 (3) | 0,087 (2) | 0,115 (3) |
sk2195 (0) | 0,067 (3) | 0,087 (2) | 0,081 (1) |
sk2198 (1) | 0,050 (3) | 0,190 (4) | 0,182 (3) |
sk2199 (0) | 0,075 (4) | 0,109 (3) | 0,108 (2) |
sk2200 (0) | 0,058 (3) | 0,130 (3) | 0,149 (4) |
Note. U = Understanding Index; D = Drill Index; I = Instability Index. Quartile values refer to within-performance-group distributions defined in Table 5. Misfit indicates whether person OUTFIT MNSQ exceeded 1.5 (1 = misfit, 0 = within acceptable range). Student identifiers are anonymized.
Schools were grouped by institutional type, and differences in average index values were examined within the above-average performance group (Table 7). The Kruskal–Wallis test indicated statistically significant differences between school types for the Instability Index (I) and the Drill Index (D), while no significant differences were observed for the Understanding Index (U).
Post-hoc Bonferroni adjusted comparisons revealed several significant pairwise differences. State gymnasiums exhibited lower average Instability values compared to distance learning and vocational schools, whereas development centers showed higher Instability relative to primary and secondary schools. For the Drill Index, state gymnasiums demonstrated lower average values compared to several other school types. These findings indicate that index distributions vary across institutional contexts within the same performance group. However, the analysis does not establish causal mechanisms underlying these differences.
To further examine institutional differences, index values were analyzed within the below-average performance group (Table 8). The Kruskal–Wallis test indicated statistically significant differences between school types for the Drill Index (D), while no significant differences were observed for the Instability (I) or Understanding (U) indices.
Post-hoc Bonferroni-adjusted comparisons revealed that Development Centers differed significantly from State Gymnasiums, Secondary Schools, Primary Schools, and Vocational Schools in terms of average Drill Index values. No other pairwise comparisons reached statistical significance. These results indicate that, within the below-average performance group, Drill Index distributions vary across certain institutional contexts. However, the analysis does not specify the underlying factors contributing to these differences.
Table 7.
Comparison of Index Values Across School Types Within the Above-Average Performance Group
School Type | Instability (I) M (SD) | Understanding (U) M (SD) | Drill (D) M (SD) |
Primary schools | 0.186 (0.024) | -0.044 (0.032) | 0.179 (0.028) |
Secondary schools | 0.187 (0.021) | -0.043 (0.024) | 0.179 (0.025) |
Distance learning schools | 0.198 (0.011) | -0.026 (0.010) | 0.189 (0.012) |
State gymnasiums | 0.173 (0.026) | -0.039 (0.021) | 0.162 (0.028) |
Vocational schools | 0.205 (0.051) | -0.041 (0.030) | 0.206 (0.076) |
Development centers | 0.253 (0.021) | -0.047 (0.050) | 0.247 (0.019) |
Note. Values represent mean (SD). Kruskal–Wallis tests indicated significant differences for Instability, H(5) = 20.352, p < .001, and Drill, H(5) = 22.143, p < .001. No significant differences were observed for Understanding, H(5) = 8.54, p = .128.
Table 8.
Comparison of Index Values Across School Types in the Below-Average Performance Group
School Type | Instability (I) | Understanding (U) | Drill (D) |
Primary schools | 0.187 (0.033) | 0.007 (0.038) | 0.197 (0.041) |
Secondary schools | 0.191 (0.028) | 0.005 (0.027) | 0.203 (0.033) |
Distance learning schools | 0.185 (0.026) | 0.019 (0.010) | 0.189 (0.031) |
State gymnasiums | 0.182 (0.025) | 0.016 (0.020) | 0.191 (0.030) |
Vocational schools | 0.191 (0.062) | -0.009 (0.032) | 0.221 (0.067) |
Development centers | 0.256 (0.067) | -0.036 (0.067) | 0.301 (0.075) |
Note. Kruskal–Wallis test results indicated statistically significant differences between school types for the Drill Index (D), H(5) = 14.973, p < .05. No statistically significant differences were observed for the Instability (I) or Understanding (U) indices.
Within the high-performance group (Table 9), no statistically significant differences were observed between school types for any of the three indices. Mean values were relatively similar across institutional categories, and variability within this group was comparatively limited.
The absence of significant differences may reflect a convergence of response patterns among higher-performing students. However, the analysis does not allow firm conclusions regarding potential ceiling effects or the alignment between item difficulty and high-ability students.
Table 9.
Comparison of Index Values Across School Types in the High-Performance Group
Instability (I) | Understanding (U) | Drill (D) | |
School type | M (SD) | M (SD) | M (SD) |
Primary schools | 0.077 (0.029) | -0.057 (0.035) | 0.056 (0.031) |
Secondary schools | 0.076 (0.023) | -0.053 (0.027) | 0.057 (0.025) |
Distance learning schools | 0.068 (0.022) | -0.051 (0.063) | 0.046 (0.024) |
State gymnasiums | 0.073 (0.017) | -0.046 (0.015) | 0.057 (0.018) |
Vocational schools | 0.072 (0.006) | -0.045 (0.009) | 0.064 (0.002) |
Development centers | 0.169 (0.000) | -0.042 (0.000) | 0.120 (0.000) |
Note. H statistics (Kruskal–Wallis) were non-significant for all indices in the high-performance group (Instability: H = 3.83; Understanding: H = 5.63; Drill: H = 4.26; df = 5; p > .05). M = mean; SD = standard deviation.
4. Discussion
This study examined aberrant response patterns in a national mathematics examination and explored how these patterns vary across institutional contexts. The results indicate statistically significant differences in the Instability Index (I) and Drill Index (D) within the above-average performance group, whereas in the below-average group, significant variation was observed only for the Drill Index (D). The absence of significant differences in the high-performance group may reflect reduced variability in index distributions at higher ability levels or potential test-targeting constraints; however, the present analysis does not allow firm conclusions regarding examination design.
Within the above-average group, state gymnasiums displayed comparatively lower mean values on the Instability and Drill indices than several other school types. Conversely, development centers showed higher Drill index values within the below-average group. These patterns may be consistent with differences in instructional alignment, student selection, or institutional context, but causal interpretations cannot be established based on the current data.
These findings are consistent with theoretical accounts of washback effects in high-stakes testing contexts (Alderson & Wall, 1993; Xie, 2013), which suggest that examination formats may shape student response patterns in ways aligned with task structure. When assessments emphasize repetitive or procedurally structured tasks, performance patterns may reflect stronger alignment with such formats relative to tasks requiring higher levels of conceptual engagement. The observed variation across school types may also be interpreted in light of prior research indicating that high-stakes examinations can influence how students orient their preparation strategies toward exam characteristics (Im et al., 2020). However, the present study does not directly measure instructional practices or learning approaches, and therefore the results should be understood as structural performance patterns rather than direct evidence of pedagogical orientation.
The comparatively higher Drill index values observed in development centers are compatible with findings suggesting that institutional contexts may differ in how students are prepared for standardized assessments (Drüke-Noe & Kühn, 2017). Nevertheless, alternative explanations—including differences in student composition, selection mechanisms, or available support structures—cannot be excluded. More broadly, the findings highlight the importance of ensuring that national assessments reflect a balanced representation of procedural and conceptual task demands. While the present study does not directly evaluate examination design, the observed response patterns suggest that variation in task structure may be associated with differences in performance profiles across institutional contexts.
Finally, this study illustrates the analytical potential of aberrant response indices when combined with qualitative item analysis. The proposed indices extend traditional person-fit statistics by decomposing overall misfit into structurally interpretable components related to item functionality, cognitive demand, and task repetition. In this sense, the framework complements conventional Outfit-based diagnostics rather than replacing them. Rather than treating person-fit statistics solely as indicators of measurement error, the proposed framework demonstrates how such metrics may contribute to the exploration of structural response patterns at both individual and institutional levels. However, interpretations regarding instructional practices should remain tentative and require further empirical validation.
Several limitations should be acknowledged. First, variability in sample sizes across school types and performance groups may influence the stability of group comparisons, particularly for institutional categories with small numbers of students. Although non-parametric procedures were applied where appropriate, unequal group sizes may limit the generalizability of the findings. Second, the study relies exclusively on examination response data and does not include direct measures of instructional practice, classroom observation, or student background characteristics. As a result, interpretations regarding instructional alignment or washback mechanisms remain indirect and should be treated with caution. Third, while differences observed in the high-performance group may relate to potential test-targeting constraints, the present analysis did not include formal examination of test information functions or item targeting. Although the indices are theoretically grounded in Rasch residual structure and expert-based item evaluation, further research is needed to examine their construct validity and stability across different examination contexts.
Future research could incorporate psychometric analyses of measurement precision across the ability continuum, as well as qualitative classroom data, to better contextualize response patterns. Future research also could extend this framework by examining longitudinal trends in aberrant response patterns to explore whether structural response profiles remain stable or change across examination cycles. Such analyses may help clarify whether observed patterns reflect short-term adaptation to assessment formats or more persistent instructional alignment. In addition, incorporating measures of student motivation, test-taking strategies, and classroom-level data would provide a more comprehensive understanding of the mechanisms underlying variation across institutional contexts. Including teacher perspectives on assessment preparation practices could further contribute to disentangling structural response patterns from pedagogical intent in the study of washback effects.
5. Conclusion
This study examined aberrant response patterns in a national mathematics examination and demonstrated how person-fit statistics, when combined with structured qualitative item analysis, can be used to explore structural differences in response profiles across institutional contexts. By operationalizing instability, cognitively weighted deviation, and drill-weighted deviation, the study identified systematic variation between school types within specific performance groups.
Differences were particularly evident in the above-average and below-average performance groups, whereas response patterns among high-performing students were comparatively homogeneous. These findings suggest that aberrant response indices may capture meaningful variation in how students interact with different task structures, although the present analysis does not establish causal links to instructional practices.
The results underscore the potential of integrating quantitative person-fit diagnostics with qualitative task analysis to move beyond treating aberrant responses solely as measurement error. Instead, such indices may contribute to the examination of structural performance patterns at both individual and institutional levels.
Future research should extend this framework longitudinally and incorporate classroom-level data, student motivation measures, and teacher perspectives to better understand the mechanisms underlying institutional variation. Expanding this approach to additional subjects and assessment contexts may further clarify how large-scale examinations interact with learning processes.
Funding details and disclosure statement
This work was supported by the project “Individualized and personalized support system for students' reading, mathematical, and scientific literacy development” (VPP-IZM-Izglītība-2023/1-0001). The authors declare no conflict of interest.
Data Availability Statement
The dataset supporting the findings of this study is publicly available in Zenodo at https://doi.org/10.5281/zenodo.15007893. The repository includes anonymized student-level data (Data.xlsx), item-level classifications (Items.xlsx), and original Winsteps output files (Tables 13, 17, 40, and Wright map). All personal and institutional identifiers have been removed in accordance with data protection regulations. The dataset is distributed under the Creative Commons Attribution–NonCommercial–NoDerivatives 4.0 International (CC BY-NC-ND 4.0) license.
How to Cite
Mikīte, M., & Burgmanis, G. (2026). What aberrant responses in a national mathematics examination reveal about student performance. Educational Methods & Psychometrics, 4 (SAMC 2024 Special Issue): 28.
References
Alderson, J. C., & Wall, D. (1993). Does washback exist? Applied Linguistics, 14(2), 115–129.
Andrews, S., Fullilove, J., & Wong, Y. (2002). Targeting washback—a case-study. System, 30(2), 207–223.
Bikner-Ahsbahs, A., & Prediger, S. (Eds.). (2014). Networking of theories as a research practice in mathematics education. Springer.
Buck, R. (1988). Human motivation and emotion. John Wiley & Sons.
Cheng, L., & Curtis, A. (2004). Washback or backwash: A review of the impact of testing on teaching and learning. In L. Cheng, Y. Watanabe, & A. Curtis (Eds.), Washback in language testing: Research contexts and methods (pp. 3–19). Lawrence Erlbaum Associates.
Conijn, J. M., Emons, W. H., & Sijtsma, K. (2014). Statistical lz-based person-fit methods for noncognitive multiscale measures. Applied Psychological Measurement, 38(2), 122–136.
Cui, Y., & Roduta Roberts, M. (2013). Validating student score inferences with person‐fit statistic and verbal reports: A person‐fit study for cognitive diagnostic assessment. Educational Measurement: Issues and Practice, 32(1), 34–42.
Drüke-Noe, C., & Kühn, S. M. (2017). Cognitive Demand of Mathematics Tasks set in European Statewide Exit Exams – Are some Competences more demanding than others? Dooley, T., & Gueudet, G. (Eds.). Proceedings of the 10th Congress of the European Society for Research in Mathematics Education (pp. 3484–3491). DCU Institute of Education and ERME.
Edwards, A., & Alcock, L. (2010). Using Rasch analysis to identify uncharacteristic responses to undergraduate assessments. Teaching Mathematics and its Applications: An International Journal of the IMA, 29(4), 165–175.
Im, H., Kwon, K. A., Jeon, H. J., & McGuire, P. (2020). The school-level standardized testing policy and math achievement in primary grades: The mediational role of math instructional approach. Studies in Educational Evaluation, 66, 100877.
Masters, G. N., & Keeves, J. P. (Eds.). (1999). Advances in measurement in educational research and assessment. Pergamon.
Meijer, R. R., Niessen, A. S. M., & Tendeiro, J. N. (2016). A practical guide to check the consistency of item response patterns in clinical research through person-fit statistics: Examples and a computer program. Assessment, 23(1), 52–62.
Meijer, R. R. (1996). Person-fit research: An introduction. Applied Measurement in Education, 9, 3–8.
Mikite, M., Burgmanis, G., France, I., & Namsone, D. (2022). What do systematic large-scale assessment test analyses in mathematics show? In EDULEARN22 Proceedings (pp. 9127-9132). IATED.
Radford, L. (2008). Theories in mathematics education: A brief inquiry into their conceptual differences. Comunicación en el ICME, 11, 6–13.
Tendeiro, J. N., Meijer, R. R. (2012). A CUSUM to detect person misfit: A discussion and some alternatives for existing procedures. Applied Psychological Measurement, 36, 420–442.
Furaidah, Saukah, A., & Widiati, U. (2015). Washback of English national examination in the Indonesian context. TEFLIN Journal, 26(1), 36–58.
Smith, M. L. (1991). Put to the test: The effects of external testing on teachers. Educational Researcher, 20(5), 8-11.
Taylor, L. (2005). Washback and impact. ELT Journal, 59(2), 154–155.
Walker, A. A., Jennings, J. K., & Engelhard, Jr, G. (2018). Using person response functions to investigate areas of person misfit related to item characteristics. Educational Assessment, 23(1), 47–68.
Xie, Q., & Andrews, S. (2013). Do test design and uses influence test preparation? Testing a model of washback with Structural equation modeling. Language Testing, 30(1), 49–70.
Xie, Q. (2015). Do component weighting and testing method affect time management and approaches to test preparation? A study on the washback mechanism. System, 50, 56–68.
Zhan, Y., & Wan, Z. H. (2016). Test takers’ beliefs and experiences of a high-stakes computer-based English listening and speaking test. RELC Journal, 47(3), 363–376.
Manuscript Received: 12 MAR 2025
Final Version Received: 03 MAR 2026
Published Online Date: 05 MAR 2026
PUBLISHED
ISSUE
