Full Html
Full Html
1. Introduction
Loneliness and Its Broader Impact
Understanding loneliness and social connection is crucial for shaping effective public policies. Nationwide online surveys with randomly selected participants provide valuable insights into loneliness as a complex, subjective and multifactorial experience that arises from a mismatch between desired and actual social relationships (DDCMS, 2018–2022; Gov.uk, 2023; HM Government, 2023; Perlman & Peplau, 1981; World Health Organization, 2021; Yanguas et al., 2018). Loneliness can affect individuals across all demographics and has well-documented negative effects on health and wellbeing. In England, nearly half of the adult population reports frequent loneliness, with unmarried middle-aged adults, elderly widows, teenagers, women and
Correspondence should be made to Austen El-Osta, Self-Care Academic Research Unit (SCARU), School of Public Health, Imperial College London, W12 0BZ, UK. Email:a.el-osta@imperial.ac.uk.
© 2026 The Authors. This is an open access article under the CC BY 4.0 license (https://creativecommons.org/licenses/by/4.0/)
people with disabilities identified as groups at higher risk (DDCMS, 2020; Macdonald & Kulakiewicz, 2021; Pyle & Evans, 2018). It is an unwelcome feeling of lacking or losing companionship and can occur even among those who are socially connected or surrounded by others.
Loneliness correlates with unhealthy behaviours, including smoking, drinking, poor diet and physical inactivity, leading to higher healthcare costs (WHO, 2021), and is associated with poorer health outcomes, early mortality, depression and cognitive decline. Strengthening social networks can enhance wellbeing, particularly among older adults and those undergoing significant life transitions requiring financial or material resources (Shankar et al., 2015).
Loneliness also incurs economic costs, with UK employers losing up to £3.7 billion annually (DDCMS, 2018; Jeffrey et al., 2017) or £9,976 per person per year (Peytrignet et al., 2020). Recognising its societal impact as a public health hazard, the UK has developed national strategies to tackle loneliness, with targeted initiatives for children and broader populations (Jopling, 2018; The Campaign to End Loneliness, 2020; Welch et al., 2023).
Defining and Measuring Loneliness
Measuring loneliness poses a considerable challenge due to its complex, multifactorial nature and its distinctly negative polarity. It is typically defined as a perceived discrepancy between desired and actual social relationships, differing from social isolation, which refers to the objective absence of social contacts or limited network size. Since loneliness lacks a strict antonym (Bevinn, 2011), researchers have explored various positive-polarity constructs to represent its opposite, such as wellbeing, belongingness, social connection or cohesion and social capital (de Jong-Gierveld & Kamphuls, 1985; Fone et al., 2006; Goldman et al., 2024; Grootaert et al., 2004). Each of these captures a distinct dimension of human social experience, ranging from individual affective bonds to collective belonging.
Among these, wellbeing has often been used as a positive counterpart to loneliness (Alhuzami, 2021; DDCMS, 2018–2022; Mansfield et al., 2021), yet it encompasses a much broader spectrum—emotional, psychological and functional—extending beyond social interaction. Instruments such as the Warwick–Edinburgh Mental Well-Being Scale (WEMWBS) (Tennant et al., 2007) are well suited for assessing overall wellbeing but not specifically the social dimension. The de Jong-Gierveld Loneliness Scale (de Jong-Gierveld & Kamphuls, 1985) partially addresses this by including both negative-polarity items (missing relationships) and positive-polarity items (belongingness). However, belongingness itself may contrast more precisely with social exclusion rather than directly opposing loneliness (Pond et al., 2011), which highlights the conceptual gap in capturing a full continuum from isolation to connection.
To fill this gap, researchers have increasingly turned to social connection as a theoretically coherent positive pole. Social connection operates at the individual level, focusing on personal relationships, perceived closeness and frequency of social contact. It is a practical and policy-relevant alternative to loneliness, informing community and public health initiatives (DDCMS, 2018; Shankar et al., 2015; Steptoe et al., 2013; WHO, 2021). Within the broader framework of social capital, which includes structural, cognitive and relational dimensions (Claridge, 2004; Scrivens & Smith, 2013), social connection represents the relational essence that unites individuals through shared identity and collective trust, integrating personal social connections within a wider sense of community belonging.
Understanding both polarities—loneliness and social connection—is essential for a comprehensive interpretation of social wellbeing. Previous studies have typically examined either loneliness, social connection, or social capital separately (Chen et al., 2009; Nyqvist et al., 2016), using distinct instruments or limited item subsets. In contrast, the present study focuses on the entire continuum, integrating both negative (loneliness) and positive (social connection) polarities within a single psychometric framework. The INTERACT Loneliness and Social Connection Scale (INTERACT-LSCS) survey was therefore developed as a composite instrument, combining items from the UCLA Loneliness Scale (UCLA-LS), social connection questionnaires, and COVID-19 social experience indicators (El-Osta et al., 2025a). By modelling the two ends of the same latent variable within a Rasch-calibrated model, this study reconceptualises them not as separate states but as complementary expressions of social connectedness.
Objectives of the present study
The main objective of this study was to conduct a comprehensive psychometric evaluation of the integrated INTERACT-LSCS, which merges items from established scales into a unified measure. Rasch modelling was applied to assess construct validity, dimensionality, item fit, response category functioning, and measurement invariance, ensuring the instrument meets the requirements of fundamental measurement. The analysis verified unidimensionality and item independence, providing objective, reliable, and sample-independent estimates of loneliness and social connection. Although the primary focus was psychometric validation, the resulting precision and interval-level scaling support future research exploring demographic differences and informing interventions that address social connection and wellbeing.
The INTERACT-LSCS analysed responses from over 135,725 NHS patients in England, making it the largest population-based investigation of loneliness and social connection in the UK (El-Osta et al., 2025a, 2025b). The 27-item questionnaire included 14 socio-demographic and 13 Likert-type items, combining three from the UCLA-LS, seven measuring social trust and two addressing COVID-19 isolation. Recruitment through NHS networks, voluntary partners, social media and research platforms such as the NIHR Be Part of Research Network ensured broad demographic reach and national relevance. Using Rasch analysis, ordinal survey data were transformed into a linear metric, yielding valid and reliable measures of loneliness and social connection and establishing a robust foundation for future targeted research and intervention design.
Framework and Analytical Approach
For the purposes of internal documentation and the technical manual, international frameworks are considered to ensure the instrument’s quality in terms of objectivity, validity, and reliability, following the principles of the COnsensus-based Standards for the Selection of Health Measurement Instruments (COSMIN) (Mokkink et al., 2024), the Strengthening the Reporting of Observational Studies in Epidemiology (STROBE) checklist (Cuschieri, 2019), and the Standards for Educational and Psychological Testing issued by the American Educational Research Association, the American Psychological Association, and the National Council on Measurement in Education (AERA–APA–NCME, 2014). Specific elements from these frameworks are not formally reported in this article, which presents the methodological process used to validate the INTERACT-LSCS scale through the Rasch model. Nonetheless, the Rasch-based analytical strategy inherently satisfies the core domains addressed by these standards, particularly those related to objectivity, construct validity, and reliability in a harmonized framework (Tristán, 2025).
All Rasch analyses were conducted using Winsteps® (Version 5.10.4.0) (Linacre, 2022). Parameter estimation followed the standard Winsteps procedure, beginning with a PROX-based normal approximation to obtain initial values, followed by Joint Maximum Likelihood Estimation (JMLE) to derive final item and person measures, standard errors, and fit statistics. Measures were expressed in logits (log-odds units), and model fit was evaluated using mean-square residual statistics and their standardised transformations. The JMLE approach was selected for its computational stability and suitability for large-scale polytomous datasets.
The study was conducted as a cross-sectional online survey distributed among NHS patients across England. Full methodological details are presented in El-Osta et al. (2025a). Briefly, participation was entirely voluntary. The questionnaire was hosted on a secure Qualtrics web platform, and invitations were widely disseminated through NHS communication channels, allowing any interested patient to take part. Over 135,725 individuals completed the survey. After excluding participants under 16 years of age, those who did not provide informed consent, and incomplete responses, the final analytical sample comprised 134,164 respondents. Participants were classified by gender and age categories according to the Office for National Statistics (ONS) and Statista standards to ensure comparability with national datasets. Further methodological details, including access to the INTERACT Study and the original item pool, are available elsewhere (El-Osta et al., 2025b).
The questionnaire was designed to measure a single latent variable encompassing two interrelated constructs with opposing polarities: loneliness and social connection. Although these are not strict antonyms, their integration allows for a broader examination of social connectedness within a unified measurement framework.
Although several items refer to neighbourhood trust and social capital, the scale is designed to measure individual perceived social connectedness rather than contextual capital. All items are self-reported and reflect respondents’ subjective evaluations of their social environment and relationships. In this sense, neighbourhood-related items function as indicators of perceived access to social resources and connection.
The variable was assessed using categorical frequency scales (“never” to “always”) and agreement scales (“strongly disagree” to “strongly agree”), with response categories coded on ordinal numeric scales appropriate to the number of categories in each item. Items with negative polarity were reverse coded so that higher scores uniformly indicated stronger social connection.
The survey consisted of 27 items, divided into two main parts:
(a) 14 socio-demographic items that provided contextual information about respondents (Table 1a).
(b) 13 Likert-type items addressing loneliness and social connection (Table 1b).
Table 1.
Items of the questionnaire
a. Socio-demographic items
ID | Socio-demographic questions |
1 | Q1_Region/Q3_postcode. What is your Region? / What is your full postcode? |
2 | Q8_age. What is your age? (in years). |
3 | Q9_gender. Gender or sex of the person in three categories: Female, Male and Other. |
4 | Q10_relatives. How many RELATIVES did you see or hear from in the last month? |
5 | Q11_friends. How many FRIENDS did you see or hear from in the last month? |
6 | Q13_employment. What is your employment status? |
7 | Q14_ethnicity. What best describes your ethnic group or background? |
8 | Q15_marital_status. What is your marital status? |
9 | Q16_pets. Do you have any pets? |
10 | Q17_education. What is your highest level of education? |
11 | Q18_children. Do you have any children? |
12 | Q19_household. How many people other than you live in your household? |
13 | Q20_disability. Do you have a disability? |
14 | Q21_conditions. Do you have any long-term health conditions (e.g. mental health, diabetes, asthma). |
Group | ID | Short label | Item in the survey | Categories | Coding |
1 | 1 | Q4LackCompanionship | How often do you feel that you lack social connection? | 3 Frequency 2 - Hardly ever 1- Some of the time 0- Often | Negative |
2 | Q5Left_out | How often do you feel left out? | |||
3 | Q6FeelIsolated | How often do you feel isolated from others? | |||
2 | 4 | Q7FeelLonely | How often do you feel lonely? | 5 Frequency 4 - Never 3- Hardly ever 2- Occasionally 1- Some of the time 0- Often or always | Negative |
3 | 5 | Help | People around here are willing to help their neighbours. | 4 Agreement | Positive |
6 | Know | This is a close-knit, or ‘‘tight’’ neighbourhood where people generally know one another. | 0- Strongly disagree 1- Disagree 2- Agree 3- Strongly agree | Positive | |
7 | Borrow | If I had to borrow £30 in an emergency, I could borrow it from a neighbour. | Positive | ||
8 | NotAlong | People in this neighbourhood generally | 3 to 0 | Negative | |
9 | Trust | People in this neighbourhood can be trusted. | 0 to 3 | Positive | |
10 | Shopping | If I were sick, I could count on my neighbours to shop for groceries for me. | 0 to 3 | Positive | |
11 | SameValues | People in this neighbourhood do not share the same values. | 3 to 0 | Negative | |
4 | 12 | COVIDLonely | The COVID-19 pandemic & lockdowns made me feel more LONELY | 4 Agreement | Negative |
13 | COVIDIsolated | The COVID-19 pandemic & lockdown made me feel more ISOLATED | 3- Strongly disagree 2- Disagree 1- Agree 0- Strongly agree | Negative |
The socio-demographic section captured essential information such as age, gender, ethnicity, education, employment, marital status, household size, health conditions, and social contact frequency (El-Osta et al., 2025a). This section of the survey characterises respondents by age, gender, health status, employment and housing conditions. These background data supported the interpretation of patterns across the loneliness–cohesion continuum and facilitated subsequent analyses of differential item functioning (DIF) across population subgroups.
The data were organized by gender and age (Table 2), acknowledging that these factors may influence individuals' perceptions of companionship and isolation. Age groups were defined based on the UK data (Office for National Statistics, 2023) and O’Neill (2025) recommendations and validated through prior Imperial College and NHS projects:
[1] Children: Under 16 years (not considered in this study)
[2] Youth: 16-24 years
[3] Young adults: 25-39 years
[4] Middle-aged adults: 40-64 years
[5] Seniors: 65 years or older
Number of individuals per age and gender
Gender | ||||
Age | Female | Male | Other | Total |
16-24 | 4 032 | 1 761 | 295 | 6 088 |
25-39 | 13 182 | 5 693 | 397 | 19 272 |
40-64 | 37 683 | 20 407 | 387 | 58 477 |
65 years or over | 27 908 | 22 227 | 192 | 50 327 |
TOTAL | 82 805 | 50 088 | 1271 | 134 164 |
The survey comprised three main sections divided into four item groups, totalling 13 Likert-type items. The first section included four items using frequency categories. Three items (Group 1) were adapted from the short version of the UCLA-LS (Russell et al., 1980; Russell, 1996), which has been studied previously (Hughes et al., 2004; Maes et al., 2022; Osborn et al., 2018; Rose et al., 2021; Todres et al., 2021; Trucharte et al., 2023; Victor et al., 2007). The fourth item (Group 2) was the Direct Measure of Loneliness (DMOL), introduced by the ONS (Snape & Martin, 2018), and commonly used in national surveys to capture self-perceived loneliness frequency.
The second section comprised seven items (Group 3) assessing social connection, operationalised through agreement categories (“strongly agree” to “strongly disagree”). These items were adapted from validated community connection and social trust scales used in studies on urban sociology and health (Elliott et al., 2014; Fone et al., 2006; Martin et al., 2004; Sampson et al., 1997; Sampson & Graif, 2009). The items explored sense of belonging, perceived reciprocity among neighbours, willingness to cooperate, and confidence in mutual support — dimensions closely aligned with the structural and cognitive aspects of social connection (Lochner et al., 1999; Salisu & Hashim, 2017).
The third section (Group 4) included the two items referring to social isolation during the COVID-19 pandemic, drawn from previous work addressing the psychosocial impacts of confinement (El-Osta et al., 2021), to capture situational disruptions to social connectedness in a public health context.
Theoretical underpinning and the Rasch model
This section outlines the theoretical and statistical foundations of the Rasch modelling procedures applied in this study. Rasch analysis ensures that the variable is measured according to the principles of fundamental measurement, providing objective, sample-independent estimates of person measures and item difficulty. In the Rasch model, item difficulty represents its position on the latent continuum: items linked to loneliness are easier or more frequently endorsed, whereas those reflecting strong social connection are harder or less frequently endorsed unless the respondent has a higher trait level. This framework allows rigorous assessment of construct validity, reliability and rating-scale functioning, while transforming ordinal responses into interval-level measures (Tennant & Conaghan, 2007) for precise population-level comparisons.
Rasch analysis (Rasch, 1980), developed by Georg Rasch and later expanded by other researchers (Bond et al., 2020; Wright & Stone, 1979), estimates the probability that a person with a given level of loneliness or social connection will select a specific survey response. Both person (B) and item (D) measures are positioned on a single linear scale, ranging from −∞ (high loneliness, low social connection) to +∞ (low loneliness, high social connection), with a neutral midpoint at 0 logits. A logit, derived from ln[p/(1-p)], represents the natural logarithm of the probability of endorsing higher social connection relative to lower, with p=0.5 corresponding to 0 logits. Logits provide uniform measurement increments, enabling hierarchical ordering of items by difficulty and precise representation of the trait.
For instance, a person with a “neutral” position (B = 0) is at the scale centre, while high loneliness (B = −2) corresponds to lower categories (0–1), and strong social connection (B = +2) to higher categories (3–4). This mapping of items and respondents along the full spectrum illustrates how distinct levels of the variable manifest in the population.
Assuming unidimensionality and local independence (Wright & Stone, 1979), the Rasch model provides invariant measurement, supporting the evaluation of rating scales, reliability, and scale construction. When the full dataset does not meet unidimensionality requirements, meaningful structure may still be identified within subsets; multidimensional Rasch models, however, are beyond the scope of this study (DeMars, 2004; Kelderman, 1996). Model assumptions were examined using fit statistics, principal components analysis of residuals, and point–measure correlations (Smith, 2002; Tennant & Pallant, 2006; Wright, 1996a). Differential item functioning (DIF) by gender was also assessed. Reliability was evaluated using separation indices G, Cronbach’s alpha (1951), and the Standard Error of Measurement (SEM). Content and face validity were assumed, as all items were drawn from previously validated instruments, while construct validity was examined using Rasch-based criteria (Baghaei, 2008).
Rasch analysis transforms ordinal responses into interval-level measures expressed in logits, positioning both items and persons along a common latent continuum ranging from lower levels (greater loneliness) to higher levels (stronger social connection). Item difficulty reflects the level of the trait required to endorse an item, while person measures locate respondents on the same scale. Rating scale functioning was evaluated through category fit and threshold ordering, ensuring that response categories are ordered, unidimensional, and consistent with the probability of category endorsement at different trait levels.
Within this framework, Rasch measurement can be examined at three complementary levels: the macro level, describing overall response probabilities across the instrument; the meso level, characterising item response curves according to item difficulty; and the micro level, focusing on category probability curves and threshold ordering within items (Andrich, 1978, 1988; Wright & Masters, 1982; Hambleton et al., 1991). Disordered thresholds are interpreted as indicative of potential problems in category interpretation.
At the macro level, scale structure and targeting were evaluated using the Wright Map and the Test Design Line (TDL). The Wright Map displays person measures and item locations on a shared latent scale, with the mean item difficulty centred at 0 logits and standard deviation markers indicating one and two standard deviations (Wright & Stone, 2004). Well-functioning instruments are characterised by an even distribution of items across the continuum, avoiding gaps or redundancy relative to the distribution of person measures.
The TDL represents the intended uniform distribution of item locations along the latent continuum and provides a reference for evaluating scale targeting and construct representation (Wright & Stone, 2004). By comparing observed item locations with this theoretical distribution, the TDL allows assessment of whether the instrument adequately covers the range of person measures and supports decisions regarding item refinement, such as adding new items or consolidating redundant ones (Tristán, 2025). For dichotomous items, the expected range typically spans −1.5 to +1.5 logits, whereas for polytomous items a regression-based approximation may be applied (Tristán & Vidal, 2007). Deviations between observed and expected item locations are evaluated in the metric of logits, with differences below approximately one quarter of a logit generally regarded as substantively small.
Measurement precision is expressed through standard errors and the separation index, defined as the ratio of the test’s adjusted standard deviation to the mean estimation error (Andrich, 1982; Wright, 2001). Its square gives the ratio of true to error variance. In practice, separation values above 2 are acceptable, and a value near 3 distinguishes low, moderate, and important levels of social connection.
Classical reliability measures, such as Cronbach’s Alpha, KR-20, or generalizability coefficients, can be derived from the separation coefficient G (Linacre, 1995; Wright, 1996b). Reliability ranges from 0 to 1; a G = 2 corresponds to Alpha ≈ 0.8, and G = 3 to Alpha ≈ 0.9 (Fisher, 1992; Tristán, 2019).
Additional analysis can be conducted at the meso level, specifically through differential item functioning (DIF), examining how distinct groups respond to items allowing for the identification of preferences or idiosyncratic perceptions regarding the item construct; furthermore, it can determine if observed differences are attributable to bias within the item itself (Tennant & Pallant, 2007).
Fit statistics evaluate data conformity by comparing observed and expected responses through squared differences. These are calculated using simple or weighted averages (Infit and Outfit) and expressed as standardized residuals or mean-square (MNSQ) values. The expected MNSQ is 1.0, with acceptable ranges of 0.7–1.3 or 0.5–1.5 (Bond et al., 2020; Linacre, 2022). Standardized residuals (Z) should fall between −2.0 and +2.0 at a 5% significance level. Extreme response patterns (e.g., consistently selecting only highest or lowest categories) do not fit the model. Items with MNSQ >1.3 (or Z >2.0) are “noisy,” while those with MNSQ <0.7 (or Z <−2.0) are “muted,” resembling the deterministic Guttman (1950) pattern (Linacre, 2022; Rudner & Wright, 1995). When respondents endorse one item, they are more likely to endorse others located lower on the scale (Hambleton et al., 1991; Wright & Stone, 2004).
If items and categories fit the Rasch model, the instrument measures a unidimensional construct. Dimensionality can be further examined using Principal Component Analysis of Residuals (PCAR) and point-measure correlations (Tennant & Pallant, 2006). Once data fit the Rasch curve, the analysis becomes sample-independent, with item difficulty (D) and person measure (B) functioning as two distinct parameters in the model (Bond et al., 2020; Rasch, 1980).
Three types of Rasch analysis can be applied to Likert-type scales (Linacre, 2005): the Rating Scale Model (Andrich, 1978, 1988), which assumes that all items share a common category structure; the Partial Credit Model (Wright & Masters, 1982), which allows each item to have its own category structure; and the Grouped Rating Scale Model (Linacre, 2005–2022; Wright, 1998), which represents an intermediate approach by grouping items with similar category structures and estimating common threshold parameters within each group.
The Rasch model transforms ordinal responses into interval-level measures, enabling the evaluation of item fit, reliability and unidimensionality while estimating missing responses directly (Waterbury, 2019). As detailed in the cited literature, ordered categories form a polytomous response structure along the latent variable, with the model estimating the probability that a person with measure B selects category Ci on an item of difficulty D.
The Grouped Rating Scale Model (GRSM) was selected as the most appropriate specification because it allows for shared category structures within conceptually related item groups while recognising differences between “frequency” and “agreement” formats of the Likert-type items, as follows:
Group 1: Three items with three frequency categories.
Group 2: One item with five frequency categories.
Group 3: Seven items with four agreement categories (coded 0–4 for positive polarity and 4–0 for negative polarity).
Group 4: Two items with four agreement categories related to COVID-19 constructs.
Previous Rasch-based analyses have examined related instruments, including translated or shortened versions of the UCLA-LS (Faustino et al., 2019; Igarashi, 2019), the De Jong-Gierveld Loneliness Scale (De Jong-Gierveld & Kamphuls, 1985), and the Warwick–Edinburgh Mental Well-being Scale (Stewart-Brown et al., 2009). However, to our knowledge, this is the first study to intentionally integrate items with opposing polarities of the variable within a single Rasch-calibrated instrument.
Main outcome measures and results
The analysis of the complete data base corresponds to the set shown in Table 3.
Total of respondents in the data base
Total of respondents | 135,725 |
Persons NOT giving consent | 1,448 |
Missing or out of the sample | 113 |
Persons giving consent | 134,164 |
Extreme respondents with perfect highest scores | 1,253 |
Extreme respondents with perfect lowest scores | 1,249 |
Measurable individuals | 131,662 |
The Rasch analysis included 131,662 measured individuals using Winsteps software. Extreme cases—participants who achieved either the maximum or minimum scores cannot be directly estimated by the Rasch model; however, their measures are approximated through the software’s algorithms. These estimations do not compromise the quality of the analysis, as each group represents fewer than 1% of the total respondents.
Analysis of the questionnaire (Macro level)
The macro-overview summarizes key Rasch model metrics for individuals and items, including fit parameters, standard errors, separation and reliability indices (Table 4), and the test characteristic curve linking raw scores to scale measures. The Wright map and test design line show item alignment and dimensionality, while extreme respondents and outliers do not compromise overall model accuracy. Reliability is high, with a separation index G and Cronbach’s Alpha indicating robust measurement of the construct.
Rasch measurement summary for persons and items
Statistic | Persons | Items |
Number analysed (non-extreme) | 131,662 | 13 |
Mean measure (logits) | 0.17 | 0.00 |
Standard deviation | 1.34 | 0.53 |
Separation index | 2.28 | 116.8 |
Reliability | 0.84 | 1.00 |
RMSE | 1.23 | 0.00 |
Raw score–measure correlation | 0.85 | – 0.38 |
Cronbach’s alpha | 0.92 | — |
Standard error of measurement (SEM) | 2.25 | — |
Missing responses (%) | — | 4.9 |
Extreme scores (%) | 1.8 | — |
The raw score–measure correlation for persons (0.85) is a consequence of the non-linear relationship between ordinal raw scores and Rasch logit measures and does not constitute a diagnostic indicator of model adequacy. Correlations approaching unity are typically observed only under restrictive conditions (Linacre, 2002) and are not a requirement for valid Rasch measurement, particularly in polytomous instruments with incomplete data. For items, the negative raw score–measure correlation reflects the inverse relationship between raw endorsement rates and item measures along the loneliness–social connection continuum.
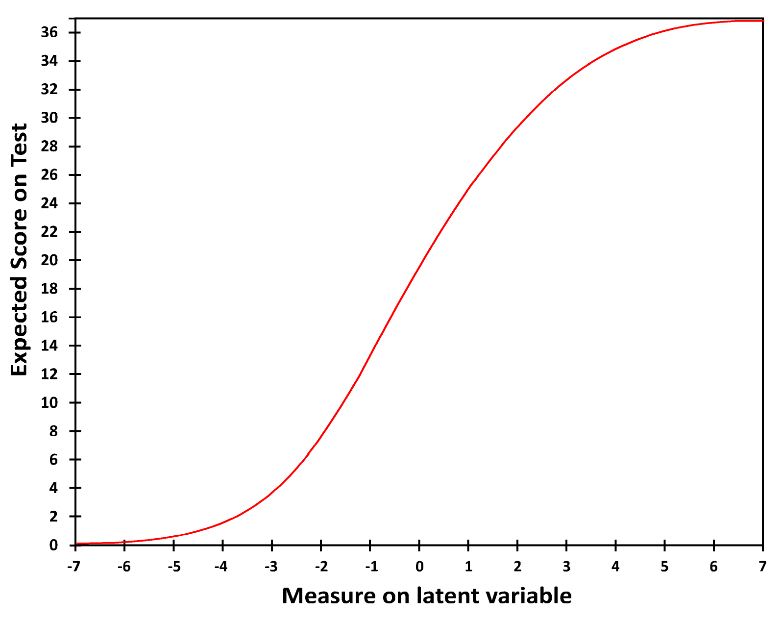
The test characteristic curve illustrates the expected score for a given measure and, conversely, the expected measure in logits for a specific raw score (Figure 1). The scale (Table 5) spans from –5.66 to +6.26 logits, representing low to high social connection (or greater to lesser loneliness). Measures for the extreme raw scores of 0 and 37 are estimated rather than directly calculated by the Rasch model.
Test characteristic curve
Raw score to measures conversion values
SCORE | MEASURE | S.E. | SCORE | MEASURE | S.E. | SCORE | MEASURE | S.E. | SCORE | MEASURE | S.E. | |||
0 | -5.66E | 1.84 | 10 | -1.49 | .42 | 20 | .13 | .41 | 30 | 2.21 | .52 | |||
1 | -4.41 | 1.03 | 11 | -1.32 | .41 | 21 | .30 | .41 | 31 | 2.50 | .55 | |||
2 | -3.65 | .75 | 12 | -1.15 | .41 | 22 | .47 | .42 | 32 | 2.81 | .58 | |||
3 | -3.18 | .63 | 13 | -.99 | .40 | 23 | .65 | .43 | 33 | 3.17 | .62 | |||
4 | -2.83 | .56 | 14 | -.83 | .40 | 24 | .84 | .44 | 34 | 3.59 | .68 | |||
5 | -2.54 | .52 | 15 | -.67 | .40 | 25 | 1.04 | .45 | 35 | 4.13 | .80 | |||
6 | -2.29 | .48 | 16 | -.51 | .40 | 26 | 1.24 | .46 | 36 | 4.96 | 1.07 | |||
7 | -2.07 | .46 | 17 | -.36 | .40 | 27 | 1.46 | .48 | 37 | 6.26E | 1.86 | |||
8 | -1.86 | .44 | 18 | -.20 | .40 | 28 | 1.70 | .49 | ||||||
9 | -1.67 | .43 | 19 | -.04 | .40 | 29 | 1.95 | .51 |
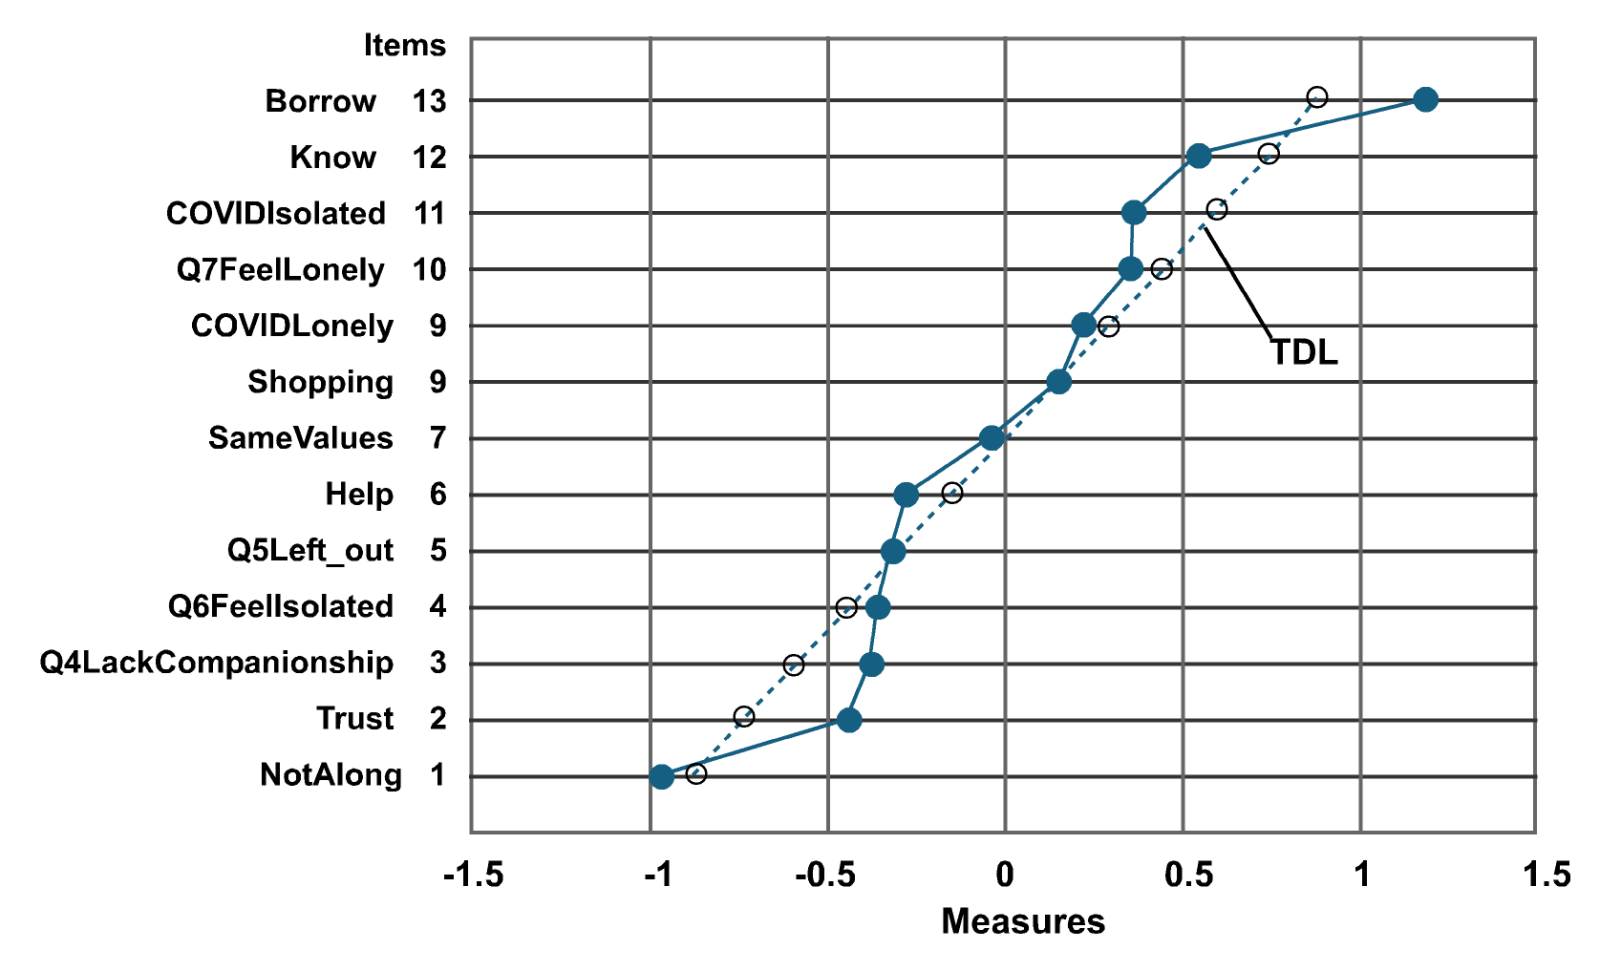
Figure 2 presents the distribution of item locations on the latent continuum following the Wright and Stone (2004) construction. Short item labels (Borrow, Know, Trust, NotAlong, etc.) are shown on the left and correspond to the full item descriptions reported in Table 1b. Two notable gaps are observed between NotAlong and Trust, and between Know and Borrow, while a clear stack is evident for Q4LackCompanionship, Q6FeelIsolated, Q5LeftOut, and Help. These gaps and clusters in item locations indicate opportunities for future scale development along the loneliness–social connection continuum. Because the present instrument integrates items drawn from widely used scales selected for their face validity and practical relevance, this study provides the first large-scale Rasch mapping of their combined measurement properties. The dotted line represents the best-fitting design line, indicating the expected uniform distribution of the 13 items along the continuum.
Items distribution and scale targeting
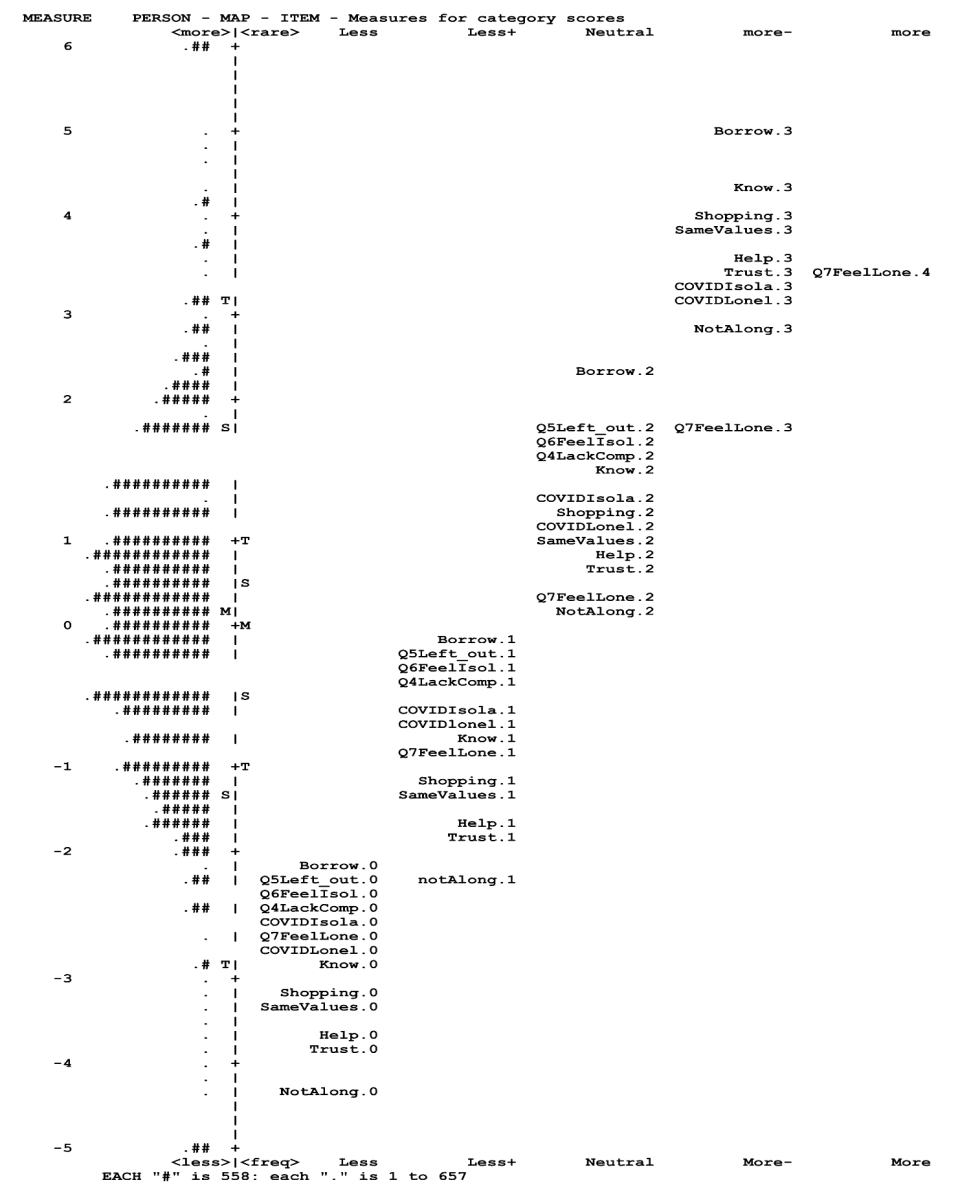
The Rasch model places item and person measures on a common latent scale, as illustrated in the Wright map (Figure 3), with item locations displayed on the right and person measures on the left. Lower positions on the map correspond to higher levels of loneliness, whereas higher positions indicate stronger social connection. The map shows a non-uniform distribution of item locations centred at 0.0 logits, alongside a bell-shaped distribution of person measures with a mean of 0.17 logits. At the extremes of the Wright map, some individuals have measures that are estimated with limited precision because relatively few item locations fall in those regions. However, when category thresholds are considered (also shown in Figure 3), the effective operational range of the scale extends well beyond the item centres, indicating broader coverage of the latent continuum. This suggests that although item locations are clustered, additional items would primarily be needed to increase measurement density and precision rather than to extend the range of the scale.
|
Wright map of the questionnaire
Analysis of the items (Meso level)
Item calibration examines Rasch item measures and fit statistics. Table 6 presents the items ordered by their estimated measures, with Borrow located at the highest end of the continuum (stronger social connection) and NotAlong at the lowest end (greater loneliness). The table reports item measures, INFIT and OUTFIT statistics and Point-Measure correlations. Overall fit is satisfactory, with all INFIT and OUTFIT MNSQ values falling within the acceptable range of 0.70 to 1.30; standard errors are below 0.01 and therefore are not included. The difference in item measures between Borrow and NotAlong exceeds 2.1 logits. In contrast, the two COVID-related items differ by only 0.14 logits, and the three UCLA items span a range of just 0.06 logits.
Item statistics
Entry | ITEM | Group | Measure | MNSQ INFIT | MNSQ OUTFIT | PtMeasure correlation |
7 | Borrow | 3 | 1.18 | 1.30 | 1.29 | .64 |
6 | Know | 3 | .54 | 1.04 | 1.06 | .60 |
13 | COVIDIsolated | 4 | .36 | 1.20 | 1.23 | .59 |
4 | Q7FeelLonely | 2 | .35 | 1.00 | 1.07 | .73 |
12 | COVIDLonely | 4 | .22 | 1.18 | 1.20 | .60 |
10 | Shopping | 3 | .15 | 1.08 | 1.08 | .68 |
11 | SameValues | 3 | -.04 | 1.06 | 1.09 | .51 |
5 | Help | 3 | -.28 | .94 | .95 | .65 |
2 | Q5Left_out | 1 | -.32 | .73 | .75 | .70 |
3 | Q6FeelIsolated | 1 | -.36 | .75 | .72 | .72 |
1 | Q4LackCompanionship | 1 | -.38 | .76 | .74 | .71 |
9 | Trust | 3 | -.44 | .83 | .82 | .60 |
8 | NotAlong | 3 | -.97 | 1.02 | 1.04 | .53 |
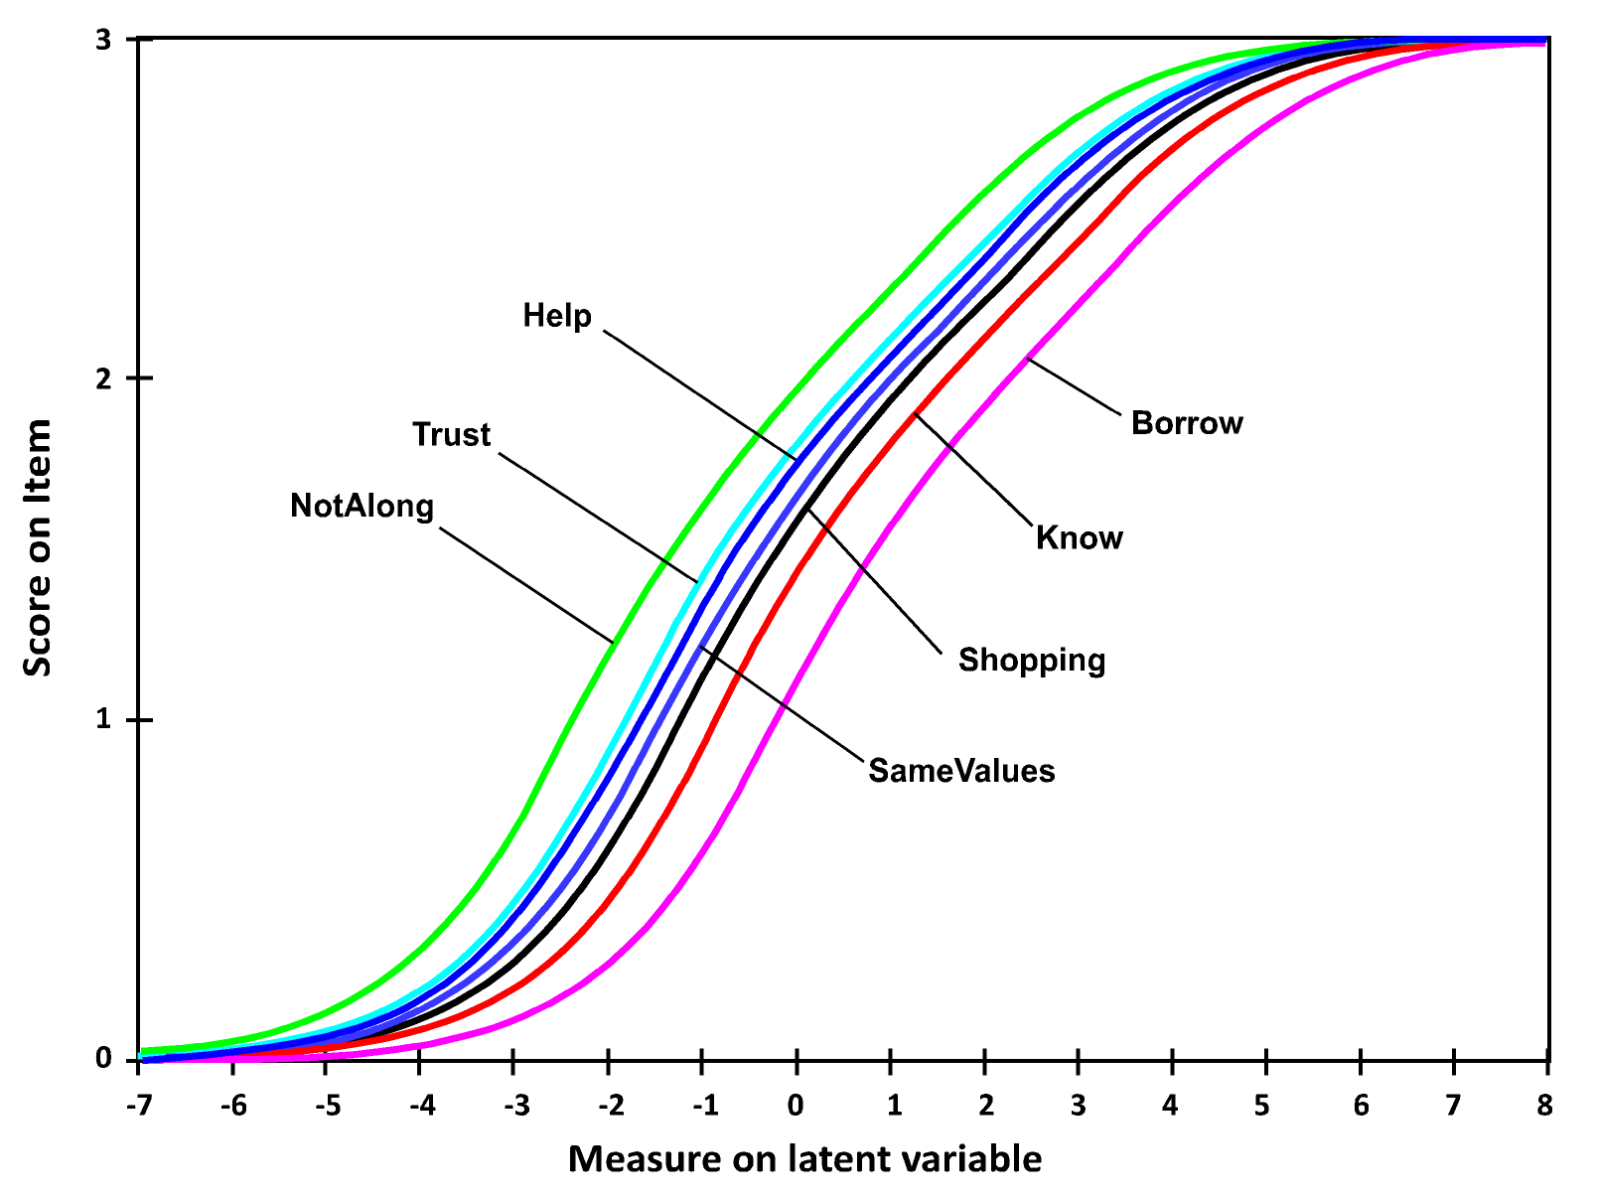
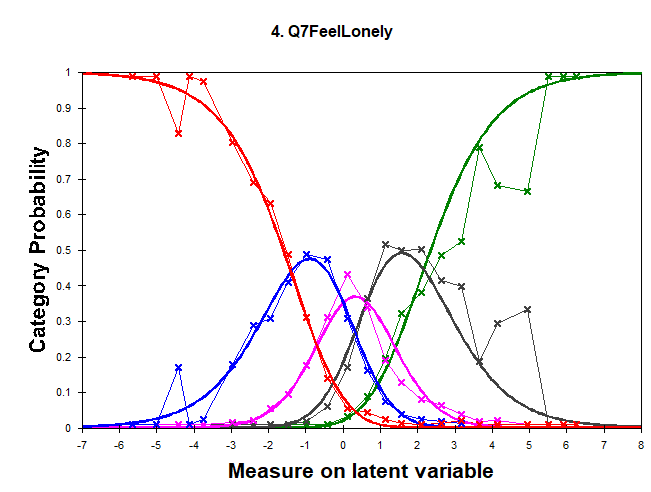
Figure 4 illustrates the Rasch curves for the 13 items. The three UCLA-LS items (Q4, Q5, Q6) and the two COVID-related items (Q12, Q13) form two coherent sets, whereas the seven social connection items span a wider range of item measures. Item Q7 shows a slight divergence from the remaining items. The Rasch item characteristic curves, which share the same response category structures within their respective groups, show consistent slopes, supporting stable item functioning across the continuum. The overall agreement of these curves with the Rasch model is consistent with previous findings on loneliness and social connection measurement (Auné et al., 2022; Faustino et al., 2019; Igarashi, 2019; Russell, 1996).

4a. Rasch models for the items of groups 1, 2 and 4
4b. Rasch models for the items of group 3
Rasch models for the set of items
Local independence
Local independence was assessed to verify that item responses were not correlated after controlling for the latent construct. Following Yen’s (1984) approach, a pairwise residual correlation matrix was computed using standardised Rasch residuals. Consistent with Winsteps-oriented Rasch guidelines, residual correlations exceeding 0.75 were considered indicative of potential local dependence, while values above 0.90 were interpreted as confirmatory (Linacre, 2022) rather than applying generic Q3 cut-offs, which may become overly sensitive in large samples.
This approach differs from recent simulation-based methodologies, such as Hagell (2026), where substantially stricter Q3-derived thresholds were proposed. Such criteria were not considered appropriate for the INTERACT-LSCS dataset, given its large population size and the intentionally integrated bipolar structure of the loneliness–social connection construct.
The analysis (Table 7) revealed no residual correlations exceeding these thresholds, except for Items 12 and 13 related to COVID-19, where some degree of association was expected due to their shared content and design. The three UCLA-LS items and the DMOL item showed the next highest residual correlations; however, these values remained below levels of practical concern, supporting the assumption of local independence required by the Rasch model.
Residual correlations used to identify dependent item
Correlation | Item A | Item B |
.77 | 12 COVIDLonely | 13 COVIDIsolated |
.46 | 2 Q5Left_out | 3 Q6FeelIsolated |
.44 | 1 Q4LackCompanionship | 3 Q6FeelIsolated |
.38 | 1 Q4LackCompanionship | 2 Q5Left_out |
.35 | 1 Q4LackCompanionship | 4 Q7FeelLonely |
.33 | 7 Borrow | 10 Shopping |
.31 | 5 Help | 6 Know |
-.35 | 10 Shopping | 12 COVIDLonely |
-.35 | 10 Shopping | 13 COVIDIsolated |
-.33 | 4 Q7FeelLonely | 10 Shopping |
-.32 | 4 Q7FeelLonely | 6 Know |
-.32 | 5 Help | 12 COVIDLonely |
-.32 | 5 Help | 13 COVIDIsolated |
-.32 | 4 Q7FeelLonely | 5 Help |
-.31 | 4 Q7FeelLonely | 7 Borrow |
-.31 | 7 Borrow | 13 COVIDIsolated |
-.31 | 7 Borrow | 12 COVIDLonely |
-.30 | 1 Q4LackCompanionship | 6 Know |
-.30 | 3 Q6FeelIsolated | 6 Know |
-.29 | 6 Know | 12 COVIDLonely |
Analysis of unidimensionality
Dimensionality was assessed using point–measure correlations and principal component analysis of residuals (PCAR). Point–measure correlations (Table 6) were all positive and exceeded the expected minimum of 0.20 (ranging from 0.51 to 0.73), indicating a consistent measurement direction across all items (Linacre, 2008).
PCAR results are reported in Table 8. The first residual contrast identified two substantively interpretable item groupings: one including the UCLA-LS items, the direct loneliness item, and the COVID-related loneliness items, and another comprising the social connection items. These groupings represent opposite poles (loneliness versus social connection) of a single bipolar construct rather than separate dimensions. Both subsets correlate strongly with the overall Rasch measure (r ≈ 0.84–0.85), supporting construct validity and the unidimensional Rasch representation of the scale.
In the Winsteps PCAR output, cluster identifiers reflect the direction of item loadings on the residual contrast rather than a sequential count of clusters. Consequently, clusters labelled “1” and “3” denote items loading on opposite sides of the same contrast, with positive and negative loadings respectively, not the presence of three distinct clusters.
Principal components and dimensionality
Raw Residual variance in Eigenvalue units | Eigenvalue | Observed | Expected |
Total raw variance in observations | 24.1868 | 100.0% | 100.0% |
Raw variance explained by measures | 11.1868 | 46.3% | 46.3% |
Raw variance explained by persons | 9.5721 | 39.6% | 39.7% |
Raw Variance explained by items | 1.6146 | 6.7% | 6.7% |
Raw unexplained variance (total) | 13.0000 | 53.7% | 53.7% |
Unexplained variance in 1st contrast | 3.4869 | 14.4% |
Approximate relationships between the PERSON measures
Clusters compared | Pearson+Extreme | Disattenuated+Extreme |
Correlation | Correlation | |
UCLA+COVID vs Social Connection | 0.4341 | 0.5327 |
UCLA+COVID vs Total | 0.8503 | |
Social Connection vs Total | 0.8409 |
Note: Disattenuated correlation correct for measurement error.
The disattenuated correlation between the two clusters was 0.53 when including extreme respondents, exceeding the recommended threshold of 0.30 (Linacre, 2022) and indicating that both clusters are related and part of the same latent construct (Table 9). Each cluster also correlated strongly with the overall Rasch measure (0.85 and 0.84), exceeding the recommended criterion of 0.70 (Linacre, 2022). This supports the interpretation of the scale as a single unified dimension, despite the bipolar structure (loneliness vs social connection), while recognising the contrasting residual patterns.
Table 9.
Loading for items in two clusters
Cluster label | Number – Item Label | Group | Loading |
1 | 1 - Q4LackCompanionship | 1 | .61 |
1 | 3 - Q6FeelIsolated | 1 | .59 |
1 | 4 - Q7FeelLonely | 2 | .59 |
1 | 2 - Q5Left_out | 1 | .55 |
1 | 12 - COVIDLonely | 4 | .45 |
1 | 13 - COVIDIsolated | 4 | .45 |
3 | 5 - Help | 3 | -.58 |
3 | 6 - Know | 3 | -.57 |
3 | 10 - Shopping | 3 | -.57 |
3 | 7 - Borrow | 3 | -.51 |
3 | 9 - Trust | 3 | -.48 |
3 | 8 - NotAlong | 3 | -.36 |
3 | 11 - SameValues | 3 | -.32 |
Note. Cluster numbering follows Winsteps PCAR conventions, where cluster labels (1 and 3) indicate loading direction on the residual contrast rather than the number of clusters.
|
|
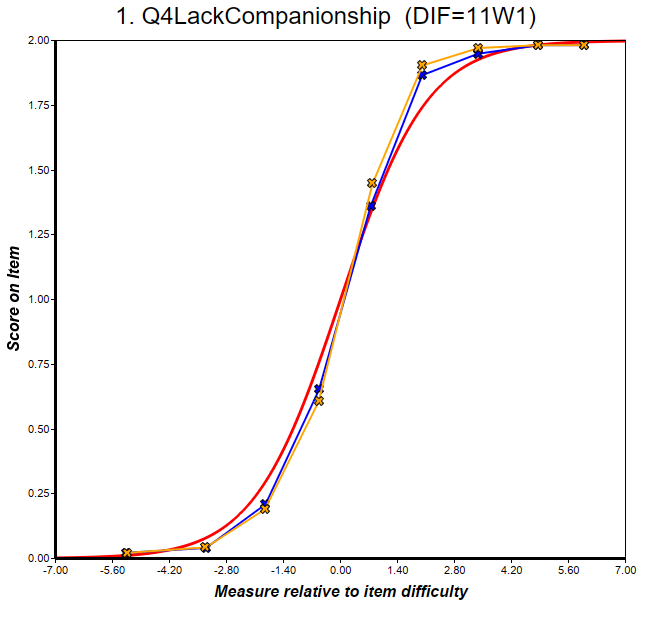
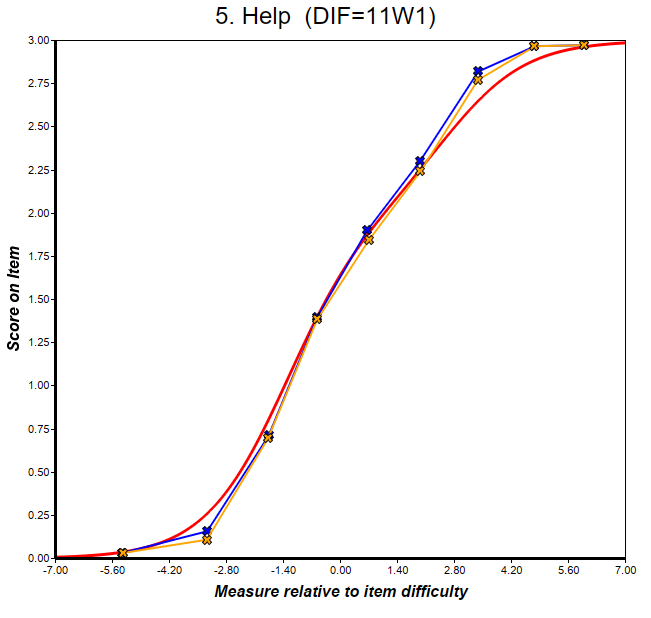
Figure 5.
Rasch-based DIF curves for two representative items comparing male and female respondents
Figure 5 presents Rasch-based DIF curves for two representative items comparing male and female respondents. These curves display the expected item scores as a function of person measures relative to item difficulty and illustrate the absence of substantive gender-related DIF at the level of item response functions, with similar results observed for the remaining items.
Figure 6 extends the DIF analysis by presenting item-level DIF contrasts across age–gender subgroups, shown separately for the four age strata. Each value represents the difference between the item measure estimated for a given age–gender subgroup and the overall item calibration. This representation allows the identification of localized DIF effects across subgroups without relying on full item response curves. Using the standard Rasch criterion of 0.5 logits, no substantive DIF was detected, with the exception of the “Other” gender category for a small number of items. For exploratory purposes, a stricter threshold (>0.25 logits) can also be examined to identify more subtle age-related differences within gender. Reference lines at 0.25 and 0.5 logits are shown to facilitate interpretation.
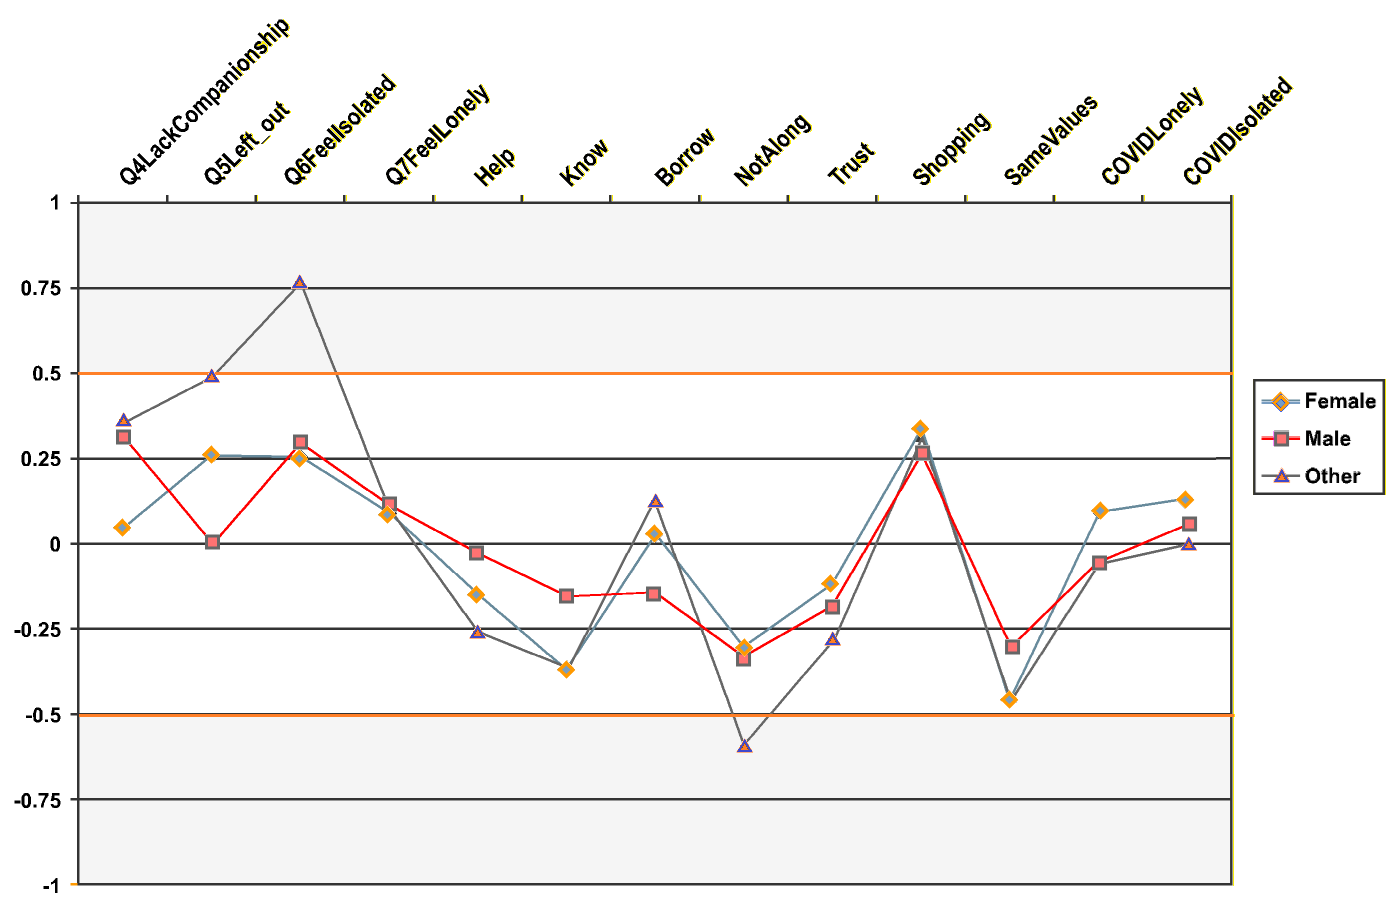
6a. DIF Youth: 16-24 years old
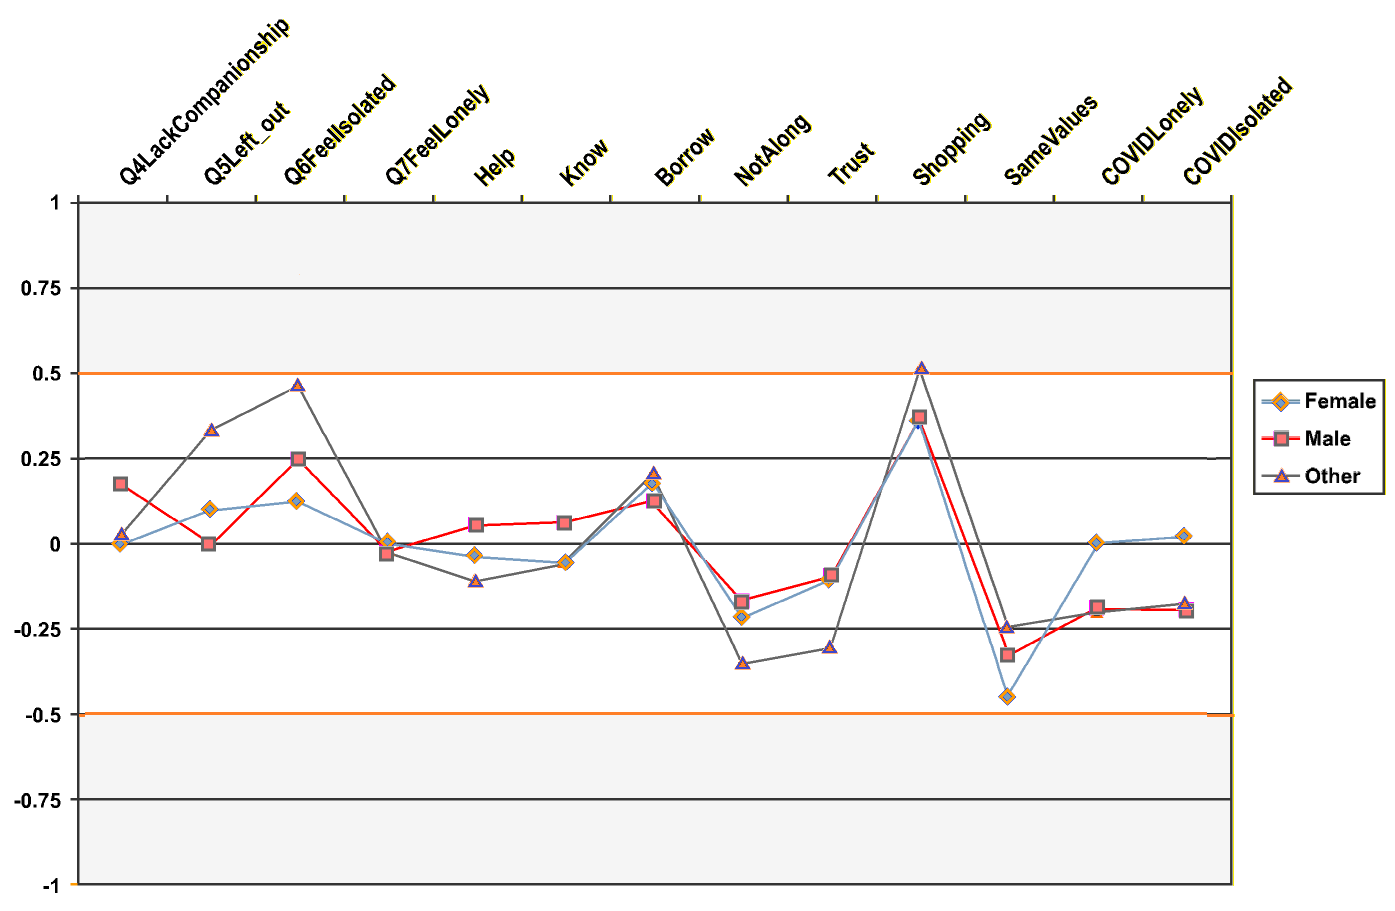
6b. Young adults: 25-39 years old
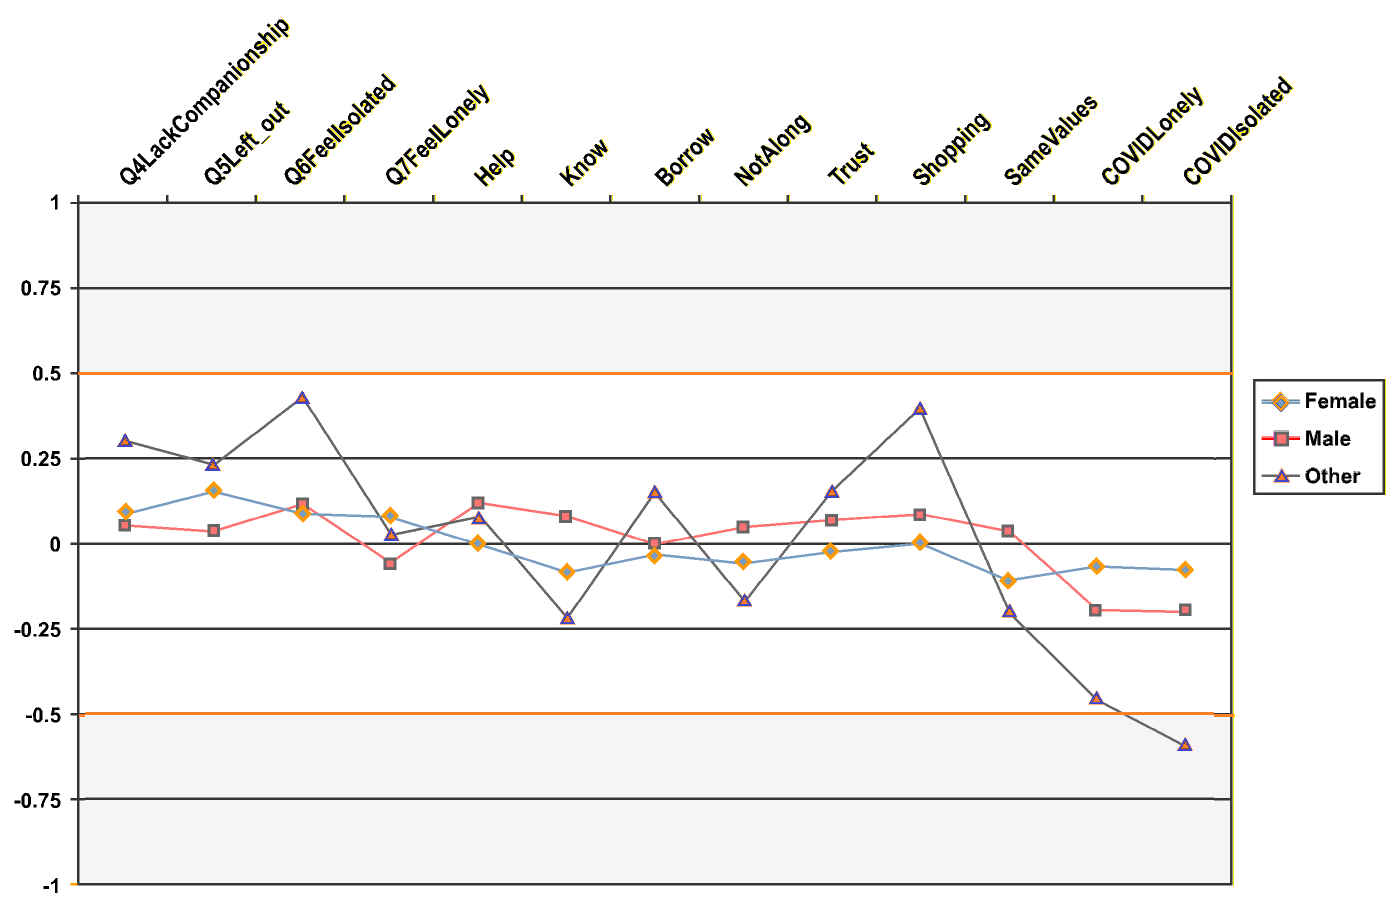
6c. DIF Middle aged adults: 40-64 years old
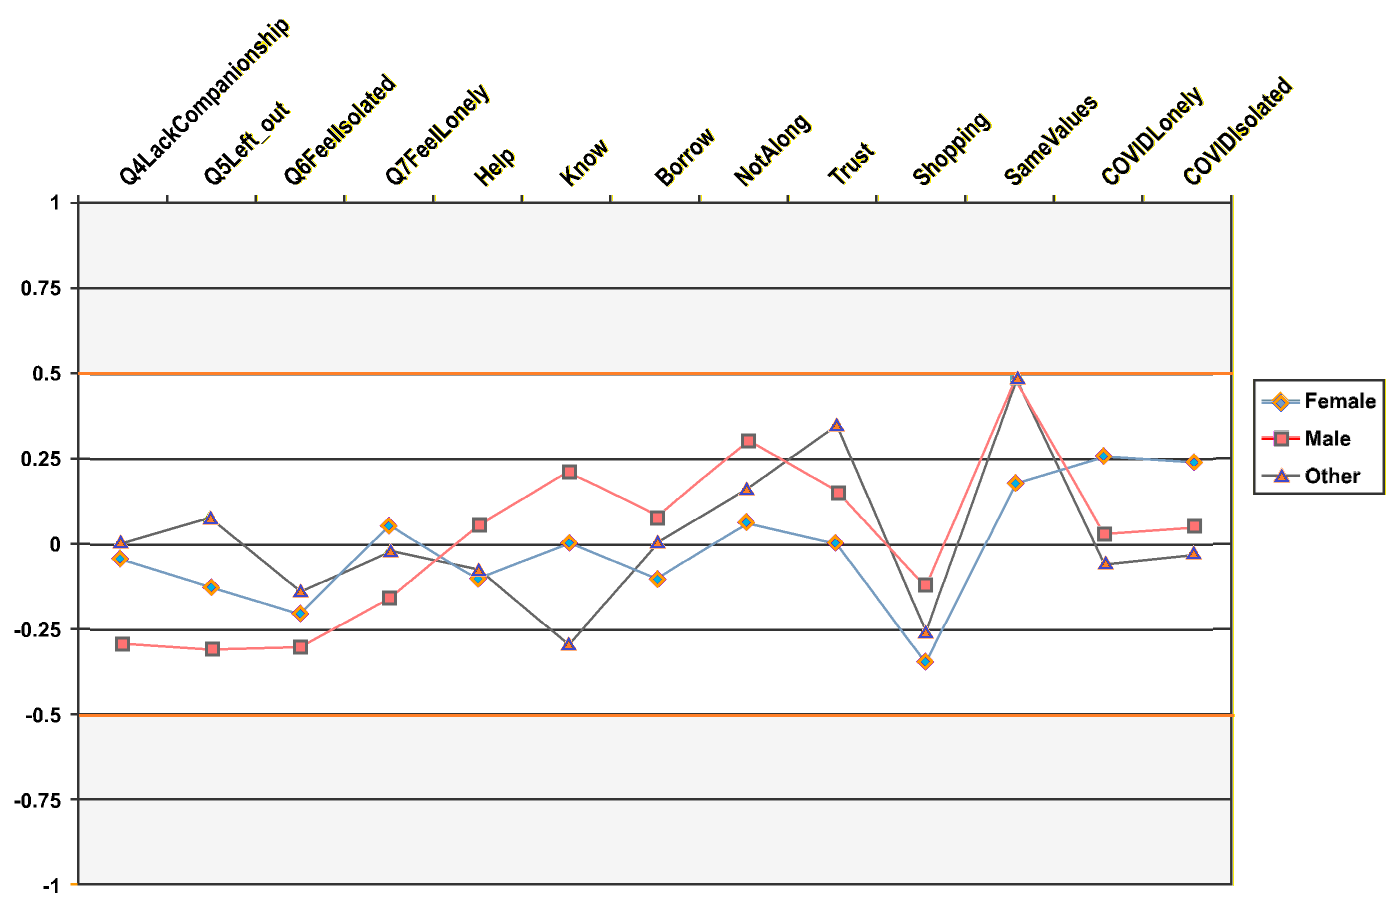
6d. DIF Seniors. 65 or older
Item-level DIF contrasts by age strata–gender subgroups. Reference thresholds at 0.25 and 0.5 logits
Descriptive subgroup comparisons
Comparisons of person measures indicated a clear age-related gradient in loneliness (Figure 7), with younger participants showing lower person measures (indicating higher loneliness) and older adults showing higher measures (indicating stronger social connection). Differences between females and males were small across age–gender subgroups, with both groups displaying very similar mean measures within each age category. In the older age groups, males showed marginally higher mean measures than females, although these differences were small in magnitude.
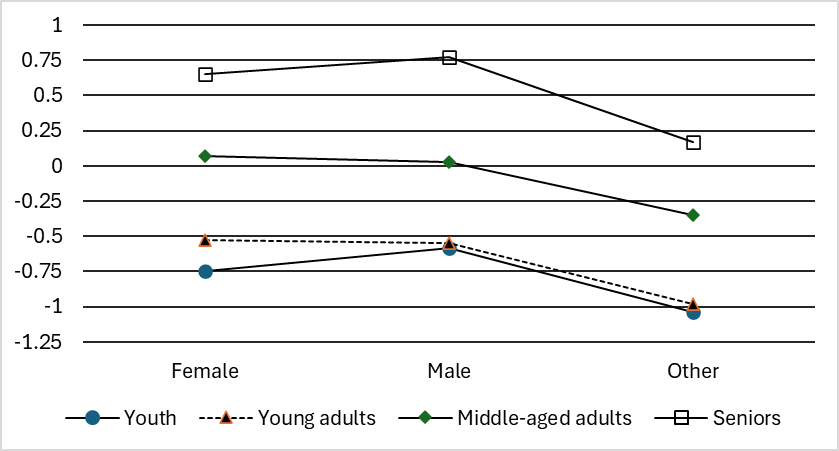
Figure 7.
Mean person measures by age-gender subgroups
A notable outcome of this large-scale analysis is the age-related gradient in loneliness, which contrasts with the common assumption that loneliness is primarily associated with older populations. Participants aged 16–24 years exhibited the highest loneliness levels, whereas respondents aged 65 and over showed comparatively higher social connection. This pattern is consistent with evidence presented in the introduction indicating that loneliness constitutes a significant wellbeing and public health concern across the lifespan. The interval-level measurement properties of the Rasch model allow these gradients to be examined with greater precision than traditional ordinal descriptive analyses. These findings provide an empirical basis for subsequent substantive and policy-oriented investigations of age-related differences in social connection and loneliness.
Analysis of Likert-type item categories (Micro level)
The results of the Rasch calibrations indicate that the response categories of the Likert-type items align closely with model expectations and are appropriately distributed, exhibiting thresholds in a monotonically increasing order.
To evaluate the impact of the 0–1-2 coding applied to three-category items and the 0–1–2–3 coding applied to four-category items, rating scale functioning was examined using category probability curves and threshold ordering. These checks were conducted in a previous phase of the analysis on a large random subsample of 15,189 respondents and yielded consistent results. As shown in Figure 8, thresholds are correctly ordered, and Table 10 shows that point–measure correlations follow the expected monotonic pattern, supporting appropriate category functioning under these coding schemes.
Figure 8 illustrates the category probability curves under the Grouped Rating Scale Model. For each group, the theoretical curves represent the shared rating structure for all items in that group, while the empirical curve corresponds to one representative item (the first item in each group). Similar response patterns were observed for the remaining items within each group.
Group 1. Items 1 to 3
| Group 2. Item 4
|
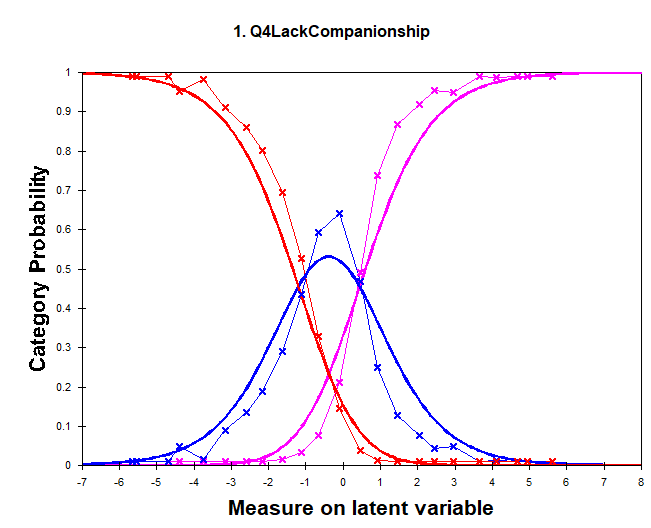
Group 3. Items 5 to 11
| Group 4. Items 12 and 13
|


Probability curves showing the thresholds for item groups
Table 10 summarises response frequencies for the 13 questionnaire items organised by measure. The “DATA COUNT %” column illustrates response patterns, to be read with the “MEAN ABILITY” column. Participants with higher loneliness measures (below 0 logits) tended to select lower categories, reflecting difficulty endorsing positive social connection statements, while those with higher measures (above 0 logits) more often chose higher categories.
Category frequencies and mean person measures
ENTRY | DATA | DATA | ABILITY | ANDRICH | S.E. | INFIT | OUTFIT | PTMA | |
Number - ITEM | CODE | COUNT | % | MEAN | THRESHOLD | MEAN | MNSQ | MNSQ | CORR. |
7- Borrow | 0 | 36879 | 30 | -0.87 | 0.01 | 1.2 | 1.2 | -0.5 | |
| 1 | 37597 | 31 | 0.02 | -2.07 | 0 | 0.9 | 0.9 | -0.08 |
| 2 | 38848 | 32 | 0.89 | -0.65 | 0.01 | 1 | 1.1 | 0.33 |
| 3 | 9870 | 8 | 2.12 | 2.72 | 0.02 | 1.2 | 1.3 | 0.41 |
| MISSING | 10970 | 8 | -0.12 | 0.02 | -0.06 | |||
|
|
| |||||||
6 - Know | 0 | 15112 | 12 | -1.26 | 0.01 | 1.1 | 1.1 | -0.39 | |
| 1 | 48121 | 39 | -0.23 | -2.07 | 0 | 1.1 | 1.1 | -0.25 |
| 2 | 51253 | 42 | 0.69 | -0.65 | 0 | 1.1 | 1.1 | 0.3 |
| 3 | 8940 | 7 | 2.14 | 2.72 | 0.02 | 1.2 | 1.1 | 0.39 |
| MISSING | 10738 | 8 | -0.16 | 0.02 | -0.07 | |||
|
|
| |||||||
13 - COVIDIsolated | 0 | 21758 | 18 | -1.13 | 0.01 | 1.1 | 1.1 | -0.44 | |
| 1 | 43150 | 35 | -0.11 | -1.82 | 0 | 1.2 | 1.2 | -0.16 |
| 2 | 40591 | 33 | 0.64 | -0.11 | 0.01 | 1.1 | 1.1 | 0.22 |
| 3 | 16861 | 14 | 1.63 | 1.93 | 0.01 | 1.4 | 1.5 | 0.41 |
| MISSING | 11804 | 9 | -0.12 | 0.02 | -0.06 | |||
|
|
| |||||||
4 - Q7FeelLonely | 0 | 22061 | 16 | -1.38 | 0.01 | 1.2 | 1.2 | -0.47 | |
| 1 | 35526 | 26 | -0.51 | -1.75 | 0 | 1 | 1 | -0.28 |
| 2 | 30857 | 23 | 0.14 | -0.34 | 0 | 0.9 | 1 | -0.01 |
| 3 | 29792 | 22 | 1.17 | 0.29 | 0.01 | 0.8 | 0.9 | 0.37 |
| 4 | 15928 | 12 | 2.02 | 1.81 | 0.01 | 1.1 | 1.2 | 0.46 |
|
|
| |||||||
12 - COVIDLonely | 0 | 20878 | 17 | -1.17 | 0.01 | 1.1 | 1.1 | -0.44 | |
| 1 | 38317 | 31 | -0.2 | -1.82 | 0 | 1.1 | 1.1 | -0.19 |
| 2 | 45588 | 37 | 0.6 | -0.11 | 0 | 1.1 | 1.1 | 0.22 |
| 3 | 18110 | 15 | 1.59 | 1.93 | 0.01 | 1.4 | 1.4 | 0.41 |
| MISSING | 11271 | 8 | -0.13 | 0.02 | -0.06 | |||
|
|
| |||||||
10 - Shopping | 0 | 15527 | 13 | -1.4 | 0.01 | 1 | 1 | -0.43 | |
| 1 | 36776 | 30 | -0.46 | -2.07 | 0 | 0.9 | 0.9 | -0.31 |
| 2 | 53316 | 43 | 0.56 | -0.65 | 0 | 0.8 | 0.8 | 0.22 |
| 3 | 17408 | 14 | 1.91 | 2.72 | 0.01 | 1 | 1 | 0.5 |
| MISSING | 11137 | 8 | -0.15 | 0.02 | -0.07 | |||
|
|
| |||||||
11 - Same Values | 0 | 6386 | 5 | -1.41 | 0.02 | 1.3 | 1.4 | -0.27 | |
| 1 | 39670 | 32 | -0.44 | -2.07 | 0.01 | 1.2 | 1.2 | -0.32 |
| 2 | 65129 | 53 | 0.49 | -0.65 | 0 | 1.1 | 1.1 | 0.22 |
| 3 | 11005 | 9 | 1.72 | 2.72 | 0.02 | 1.4 | 1.3 | 0.34 |
| MISSING | 11974 | 9 | -0.12 | 0.02 | -0.06 | |||
|
|
| |||||||
5 - Help | 0 | 9754 | 8 | -1.44 | 0.01 | 1.2 | 1.3 | -0.34 | |
| 1 | 28260 | 23 | -0.78 | -2.07 | 0 | 0.7 | 0.7 | -0.38 |
| 2 | 69581 | 56 | 0.4 | -0.65 | 0 | 0.8 | 0.8 | 0.16 |
| 3 | 16509 | 13 | 1.98 | 2.72 | 0.01 | 0.9 | 0.9 | 0.5 |
| MISSING | 10060 | 7 | -0.17 | 0.02 | -0.07 | |||
|
|
| |||||||
2 - Q5Left_out | 0 | 28120 | 21 | -1.38 | 0.01 | 0.8 | 0.7 | -0.54 | |
| 1 | 55731 | 42 | -0.11 | -0.82 | 0 | 0.8 | 0.8 | -0.16 |
| 2 | 50313 | 38 | 1.34 | 0.82 | 0.01 | 0.8 | 0.8 | 0.62 |
|
|
| |||||||
3 - Q6FeelIsolated | 0 | 30208 | 23 | -1.35 | 0.01 | 0.8 | 0.8 | -0.56 | |
| 1 | 49537 | 37 | -0.17 | -0.82 | 0 | 0.7 | 0.6 | -0.18 |
| 2 | 54419 | 41 | 1.32 | 0.82 | 0 | 0.7 | 0.7 | 0.65 |
|
|
| |||||||
1-Q4LackCompanionship | 0 | 29468 | 22 | -1.34 | 0.01 | 0.8 | 0.8 | -0.55 | |
| 1 | 50403 | 38 | -0.18 | -0.82 | 0 | 0.7 | 0.7 | -0.19 |
| 2 | 54293 | 40 | 1.32 | 0.82 | 0.01 | 0.8 | 0.8 | 0.65 |
|
|
| |||||||
9 - Trust | 0 | 6107 | 5 | -1.57 | 0.02 | 1.2 | 1.3 | -0.29 | |
| 1 | 24286 | 20 | -0.86 | -2.07 | 0.01 | 0.8 | 0.8 | -0.38 |
| 2 | 79385 | 65 | 0.37 | -0.65 | 0 | 1 | 0.9 | 0.17 |
| 3 | 12744 | 10 | 2 | 2.72 | 0.01 | 1 | 0.9 | 0.44 |
| MISSING | 11642 | 9 | -0.14 | 0.02 | -0.07 | |||
|
|
| |||||||
8 - NotAlong | 0 | 3041 | 2 | -1.52 | 0.04 | 1.6 | 1.8 | -0.2 | |
| 1 | 19723 | 16 | -0.86 | -2.07 | 0.01 | 1 | 1.1 | -0.33 |
| 2 | 75800 | 62 | 0.14 | -0.65 | 0 | 1 | 1 | -0.06 |
| 3 | 24170 | 20 | 1.47 | 2.72 | 0.01 | 1.1 | 1 | 0.45 |
| MISSING | 11430 | 9 | -0.14 |
| 0.02 | -0.06 |
The mean loneliness measures for responses in each category follow a monotonically increasing pattern: lower categories correspond to greater loneliness, and higher categories to stronger social connection. Thresholds are aligned monotonically with the direction of the variable, confirming adequate category functioning. Missing responses appeared in nine items, randomly distributed (mean ability ≈ 0 logits, SE > 1.0), with a maximum 9% overall rate in four items—well manageable for Rasch analysis.
INFIT and OUTFIT values were within the expected 0.5–1.5 range, except for minor deviations in items 8, 11, and 13, which did not affect model fit, as point–measure correlations followed the expected negative-to-positive trend. This confirms adequate item coding and stable model performance.
The two COVID-related items showed almost identical measures, fit and point-measure correlations, suggesting that one could be removed without loss of information. Slight differences appeared only among males aged 16–24, with no meaningful impact on overall results.
Overall, these findings confirm that the rating scale operates consistently across items and respondents, thereby reinforcing the construct validity and measurement precision of the INTERACT-LSCS within the Rasch model framework, in line with the criteria proposed by Baghaei (2008).
The INTERACT-LSCS investigated loneliness and social connection in a large UK sample, using the Rasch model to evaluate these constructs as a unified variable with significant implications for mental and physical health. This study details the model’s fundamentals and offers an in-depth item analysis within a single instrument. By applying Rasch output parameters at macro, meso and micro levels, it supports pioneering NHS and public health research in collaboration with Imperial College London Self-Care Academic Research Unit (SCARU) and Imperial College Healthcare NHS Trust.
This study evaluated a questionnaire designed to measure loneliness and social connection in a diverse UK population, integrating items from the UCLA-LS, Social Capital, and NHS scales. Data from 134,164 individuals enabled a robust psychometric analysis, representing the first large-scale validation of this combined item set. While the instrument can support individual-level screening of perceived loneliness and social connection, its primary strength lies in population-level monitoring of perceived social experience.
The interval-level properties derived from Rasch modelling substantially strengthen this monitoring function. Unlike traditional summed ordinal scores, Rasch-calibrated measures provide linear, invariant estimates that permit valid comparison across demographic groups and time points. This enables detection of small but meaningful shifts in population-level social connectedness that may not be observable using conventional scoring approaches. As such, the INTERACT-LSCS offers potential utility as a scalable surveillance instrument within NHS and Integrated Care System infrastructures, supporting benchmarking across regions and longitudinal evaluation of population trends.
The Rasch analysis of the INTERACT-LSCS confirmed that the Likert-type scales accurately measure the construct in line with the expected behaviour of the variable. At the macro level, the questionnaire showed a robust structure and good model fit, producing linear measures with all categories well understood by respondents thus avoiding the need to collapse categories and preserving psychometric integrity.
Using the Grouped Rating Scale Model, the analysis achieved an acceptable fit with appropriate thresholds. The hierarchical ordering of items in the Wright Map and Test Design Line captured the social connection–loneliness continuum for both individuals and items. Applying the Rasch model to the INTERACT-LSCS enhanced measurement precision and produced interval-level measures, enabling the identification of high-risk groups across age ranges and supporting targeted, evidence-based interventions.
Principal component analysis of residuals and point–measure correlations confirmed that the 13-item questionnaire measures a single latent dimension, with the items representing two complementary perspectives of the same construct. Scale uniformity could be improved by adding items to address existing gaps. If scale reduction were pursued, the alignment among the UCLA-LS items suggests that a single representative item (item 1) could be retained, while for the COVID-related items, item 12 could be selected. These adjustments would reduce the instrument from 13 to 10 items, creating space for additional items that capture new facets of loneliness and enhance the overall precision of the scale.
The Rasch model provides a rigorous framework for evaluating whether Likert scale categories function as intended and accurately represent respondents’ perceptions. In doing so, it supports the refinement, interpretation, and potential extension of the instrument within the broader construct of social connection.
The observed age-related gradient in loneliness also has practical implications for resource allocation and prevention strategy. Recent global reviews of national loneliness strategies indicate that policy responses have frequently prioritised older populations (Goldman et al., 2024; Goldman et al., 2026). However, the present findings suggest that late adolescence and early adulthood may represent a critical intervention window targeted youth-focused initiatives, including educational settings, digitally mediated engagement strategies, and primary care-based early identification, may therefore warrant increased emphasis within public health planning.
Collectively, these findings support a bipolar conceptualisation of social connectedness in which loneliness and social connection function as opposing expressions of a single latent continuum rather than as independent constructs. The strong correlations of both poles with the overall Rasch measure reinforce the interpretation that perceived social disconnection and perceived relational integration are psychometrically unified within a coherent measurement framework.
Comparison to the existing literature
The findings align with previous research on loneliness, particularly studies using the UCLA-LS, one of the most widely applied instruments for assessing loneliness across populations. The comparisons of gender–age offer insights into how companionship and loneliness are perceived among demographic groups, helping to determine whether perceptions of social connection vary between certain groups of respondents. Consistent with earlier studies, our analysis supports the validity of the UCLA-LS but also reveals redundancy among some items, a limitation previously noted by Russell (1996) and Hughes et al. (2004). This reflects a common challenge in loneliness research: achieving a balance between conceptual breadth and item efficiency.
Together, the multi-cluster structure, strong correlations with the primary trait, and evidence of scale validity support both structural and construct validity. While the UCLA-LS is often treated as a “gold standard” for loneliness, COSMIN (Mokkink et al., 2024) notes that true gold standards rarely exist for patient-reported outcome measures (PROMs), except when comparing short forms to their original versions. Thus, comparing the INTERACT-LSCS with the UCLA-LS contributes to construct validity and may also support criterion validity due to the widespread use and established reputation of this scale.
Additionally, this study’s exploration of social connection through items like neighbourhood trust and support is consistent with social capital literature (for instance Sampson et al., 1997), which emphasize the critical role of social trust in fostering connection. However, while previous studies primarily focused on smaller sample sizes or specific communities, this study’s sample provides more robust insights into the broader population’s experiences, offering a more generalized understanding of social connection in the UK context.
The inclusion of items related to the COVID-19 pandemic sets this study apart from much of the pre-pandemic literature on loneliness and social isolation. Hwang et al. (2020) and Wu (2020) have noted the exacerbating effects of the pandemic on loneliness, but the present analysis showed non-significant difference in measures of the two COVID-19-related items, suggesting they capture similar aspects of isolation, as observed by previous studies (El-Osta et al., 2021).
In summary, this analysis corroborates the validity of widely used measures of loneliness but underscores the need for refining instruments to improve efficiency. It also contributes new insights by contextualizing social connection within the pandemic and offering evidence at a national scale, providing a broader understanding of loneliness compared to existing, smaller-scale studies.
A key strength of this study lies in its exceptional sample of over 135,725 NHS patients, enhancing the generalisability of findings across diverse demographic groups in England.
Applying the Rasch model provided robust psychometric validation of the INTERACT-LSCS questionnaire, confirming unidimensionality, interval-level measurement and internal consistency (Cronbach’s alpha = 0.92). The items displayed a clear hierarchy of difficulty, with notable similarity among several—particularly those derived from the UCLA-LS and the two COVID-related items—suggesting opportunities for future refinement.
Limitations include the cross-sectional design, which restricts causal inference, and potential selection bias from online administration favouring digitally literate participants. Although anonymity and standardised procedures supported measurement independence, representativeness could be improved through mixed recruitment, including in-person or assisted participation.
The broad “Other” demographic category may also conceal relevant subgroup differences and merits further exploration.
Self-reported data may be affected by social desirability or recall bias, while residual confounding from socioeconomic status, ethnicity, or mental health cannot be excluded. Future studies should use longitudinal or mixed-methods designs to track trends, refine items, and enhance the scale’s precision and policy relevance, especially as the context of COVID-19-related items evolves.
The analysis of the INTERACT-LSCS reveals that certain items function differently across respondent groups, suggesting variations in how these items are interpreted or valued. In particular, two items linked to the COVID-19 pandemic may have limited relevance in future applications, while three items originating from the UCLA-LS—a tool widely used for its established reliability and its sole focus on loneliness as a screening instrument—appear conceptually redundant.
Neither the original authors nor subsequent users have revised these items or evaluated their suitability within a broader measurement framework. This analysis highlights the need to refine item distribution, reconsider the scale’s composition, and adopt clearer operational definitions in order to enhance measurement precision and fairness across diverse populations.
The Wright maps with category thresholds demonstrate expanded operational coverage of the latent continuum, yet the distribution of central item calibrations continues to show identifiable clusters and gaps. The thresholds describe the functional range of the response categories, whereas the gaps refer specifically to regions of the scale with lower item density, indicating where additional items could further strengthen measurement precision. Overall, the measurement framework remains robust for the general population, as the Rasch model enables a comprehensive evaluation at macro, meso, and micro levels, supporting construct validity, appropriate item functioning, and satisfactory measurement precision.
Future revisions might therefore involve removing redundant items and introducing new ones to ensure better coverage across the loneliness–social connection spectrum.
Combined with demographic and regional analyses (El-Osta et al., 2025b), these findings offer actionable insights for policymakers and healthcare providers to design targeted, evidence-based interventions that enhance social and emotional well-being (Mansfield et al., 2021; Nyqvist et al., 2016; Victor et al., 2007).
Whilst this manuscript does not explicitly reference the Standards for Educational and Psychological Testing (AERA–APA–NCME) or the COSMIN guidelines, the study is aligned with both through a harmonised approach to validity, objectivity, and reliability. As indicated in the Strengths and Limitations section, the cross-sectional design limits the study to descriptive and associative interpretations, and causal inferences have been appropriately avoided.
Public Health and System Applications
The scale’s psychometric robustness positions it for integration into applied health system contexts. Rasch-calibrated person measures enable empirically defensible threshold development, supporting stratification of individuals or communities according to degree of social disconnection rather than relying on arbitrary raw-score cut-offs. This opens the possibility of embedding the INTERACT-LSCS within primary care digital platforms, social prescribing pathways, or NHS patient-reported outcome infrastructures, where interval-level scoring enhances interpretability and comparability.
At a system level, the instrument may support evaluation of community-based interventions aimed at strengthening neighbourhood trust, reciprocity and social participation. Because the Rasch model ensures minimal differential item functioning across age and gender groups, observed subgroup differences are more likely to reflect substantive variation rather than measurement artefact. This strengthens the validity of using the instrument for equity monitoring and targeted commissioning decisions.
Furthermore, the Wright map analysis highlights identifiable gaps and clustering across the continuum, offering a framework for iterative scale refinement or expansion into an item bank. Such development could ultimately support computer-adaptive testing approaches, reducing respondent burden while preserving measurement precision.
Advantages of the study
This research provides valuable insights for future health applications. In particular, the instrument offers a refined approach to assessing loneliness and social connection by converting ordinal responses into linear, Rasch-based measures. Unlike traditional descriptive tools, this method produces objective and comparable estimates that enhance interpretability and precision. The validated INTERACT-LSCS demonstrated satisfactory construct validity and reliability across diverse populations, supporting the generation of high-quality, generalisable data for health research.
These findings enable the development of more targeted NHS interventions and evidence-based policies to address loneliness and isolation. Furthermore, the identification of demographic differences deepens understanding of the social determinants of wellbeing, underscoring the value of rigorous psychometric modelling in future population-health applications.
The INTERACT-LSCS provides a rigorously validated instrument for measuring loneliness and social connection along a single latent continuum. Rasch analysis confirmed the scale’s construct validity, reliability, and unidimensionality, establishing a solid measurement foundation. By combining items from the UCLA-LS, social trust measures, and COVID-19 indicators, this study offers a comprehensive, psychometrically sound tool.
The INTERACT-LSCS shows minimal DIF, clear item hierarchy, and high reliability. It can be refined into a concise version for large-scale screening or expanded to address measurement gaps and extreme responses for in-depth assessment. Attention to age- and gender-specific patterns enhances its applicability and policy relevance, supporting interventions that mitigate loneliness and strengthen social well-being across the lifespan. Future research should explore contextual, socioeconomic, and health-related influences, and test measurement invariance over time and across subgroups.
By situating loneliness and social connection within a robust, unidimensional framework, the INTERACT-LSCS enables precise, actionable insights to guide population-level health interventions.
Acknowledgements
The authors are grateful to Professor Pamela Qualter for suggesting we include the Social Connection items in the INTERACT-LSCS for data collection tool. The authors appreciate the insightful comments by Dr John Michael Linacre regarding the unidimensionality of the variable reported in the Winsteps software. The authors also thank Mr Aos Alaa (INTERACT Study Coordinator), Mrs Sandra O’Sullivan, Dr Arti Sharma, the NIHR Research Delivery Networks, and the NIHR Be Part of Research (BPoR) Network for their support in recruiting study participants.
All authors provided substantial contributions to the conception, design, acquisition (AEO), and interpretation (ATL, AM, and AEO) of study data. AEO took the lead in planning the study with support from co-authors. ATL carried out the data analysis with support from AEO. ATL developed the manuscript with support from co-authors. AEO is the guarantor.
This research received no funding. AEO and AM are grateful for support by the National Institute for Health and Care Research (NIHR) Applied Research Collaboration Northwest London. The views expressed in this article are those of the authors and not necessarily those of the NIHR or the Department of Health and Social Care.
Availability of data and materials
No new data were created during this study. Data sharing is not applicable to this article.
Ethics approval and consent to participate
The INTERACT Study was registered on the NIHR Portfolio (CPMS#52230) and received formal approval from the NHS Research Ethics Committee (#21IC6950) and the Imperial College London Research Ethics Committee (ICREC #305483). Survey respondents provided electronic consent prior to participation. Data confidentiality and anonymity were strictly maintained: all responses were pseudonymised at the point of entry, no personal identifiers (e.g., IP addresses) were collected, and data were stored on secure, encrypted servers at Imperial College London in compliance with GDPR and the Data Protection Act 2018. All data will be archived securely for a minimum of ten years following study completion. As this article presents only methodological and analytical procedures, there are no direct human implications, and informed consent for publication was not required.
The authors declare no competing interests.
How to Cite
Tristán-López, A., Majeed, A., & El-Osta, A. (2026). A Rasch-based psychometric evaluation of a 13-item loneliness and social connection scale in over 135,000 adults. Educational Methods & Psychometrics, 4: 29. https://doi.org/10.65301/emp.2026.263
References
Alhuzami, N. (2021). Alone in the crowd: An investigation of the factors related to the feeling of loneliness in social network sites. International Journal of Humanities and Social Science, 11(8), 131–142. https://doi.org/10.30845/ijhss.v11n8p15
American Educational Research Association, American Psychological Association, & National Council on Measurement in Education. (2014). Standards for educational and psychological testing. American Educational Research Association. https://www.apa.org/science/programs/testing/standards
Andrich, D. (1978). A rating formulation for ordered response categories. Psychometrika, 43(4), 561–573. https://doi.org/10.1007/BF02293814
Andrich, D. (1982). An index of person separation in latent trait theory, the traditional KR-20 index, and the Guttman scale response pattern. Educational Research Perspectives, 9(1), 95–104. https://www.rasch.org/erp7.htm
Andrich, D. (1988). A general form of Rasch's extended logistic model for partial credit scoring. Applied Measurement in Education, 1(4), 363–378. https://doi.org/10.1207/s15324818ame0104_7
Auné, S. E., Abal, F. J. P., & Attorresi, H. F. (2022). Modeling of the UCLA Loneliness Scale according to multidimensional item response theory. Current Psychology, 41, 1213–1220. https://doi.org/10.1007/s12144-020-00646-y
Baghaei, P. (2008). The Rasch model as a construct validation tool. Rasch Measurement Transactions, 22(1), 1145–1146. https://www.rasch.org/rmt/rmt221a.htm
Bevinn, S. J. (2011). Psychology of loneliness. Nova Science Publishers.
Bond, T. G., Yan, Z., & Heene, M. (2020). Applying the Rasch model: Fundamental measurement in the human sciences (3rd ed.). Routledge.
Chen, X., Stanton, B., Gong, J., Fang, X., & Li, X. (2009). Personal social capital scale: An instrument for health and behavioral research. Health Education Research, 24(2), 306–317. https://doi.org/10.1093/her/cyn020
Claridge, T. (2004). Social capital and natural resource management: An important role for social capital? (Unpublished doctoral thesis). University of Queensland. https://www.socialcapitalresearch.com/literature/operationalisation/measurement/
Cronbach, L. J. (1951). Coefficient alpha and the internal structure of tests. Psychometrika, 16(3), 297–334. https://doi.org/10.1007/BF02310555
Cuschieri, S. (2019). The STROBE guidelines. Saudi Journal of Anaesthesia, 13(Suppl. 1), S31–S34. https://doi.org/10.4103/sja.SJA_543_18
De Jong-Gierveld, J., & Kamphuls, F. (1985). The development of a Rasch-type loneliness scale. Applied Psychological Measurement, 9(3), 289–299. https://doi.org/10.1177/014662168500900307
DeMars, C. E. (2004). Measuring higher education outcomes with a multidimensional Rasch model. Journal of Applied Measurement, 5(4), 350–361.
Department for Digital, Culture, Media & Sport. (2018). A connected society: A strategy for tackling loneliness. https://www.gov.uk/government/publications/a-connected-society-a-strategy-for-tackling-loneliness
Department for Digital, Culture, Media & Sport. (2020). Community life survey: Technical report 2019/20. Kantar Public. https://assets.publishing.service.gov.uk/media/602e6255e90e07660f807b37/Community_Life_Online_and_Paper_Survey_Technical_Report_-_2019-20_V2.pdf
Department for Digital, Culture, Media & Sport. (2022). Investigating factors associated with loneliness in adults in England. https://www.gov.uk/government/publications/factors-associated-with-loneliness-in-adults-in-england
Draba, R. E. (1977). The identification and interpretation of item bias (Educational Statistics Laboratory Memo 25). University of Chicago. https://www.rasch.org/memo25.htm
Elliott, J., Gale, C. R., Parsons, S., & Kuh, D. (2014). Neighbourhood cohesion and mental wellbeing among older adults: A mixed methods approach. Social Science & Medicine, 107, 44–51. https://doi.org/10.1016/j.socscimed.2014.02.027
El-Osta, A., Alaa, A., Webber, I., Riboli, S. E., Bagkeris, E., Millar, H., et al. (2021). How is the COVID-19 lockdown impacting the mental health of parents of school-age children in the UK? BMJ Open, 11(3), e043397. https://doi.org/10.1136/bmjopen-2020-043397
El-Osta, A., Al-Ammouri, M., Alaa, A., Altalib, S., Tristán-López, A., & Majeed, A. (2025a). Measuring loneliness at an unprecedented scale: The INTERACT study’s approach and initial findings [Preprint]. https://doi.org/10.21203/rs.3.rs-6864072/v1
El-Osta, A., Al-Ammouri, M., Alaa, A., Altalib, S., Tristán-López, A., & Majeed, A. (2025b). Unpacking the predictors of loneliness: An inferential analysis from the INTERACT study [Preprint]. https://doi.org/10.21203/rs.3.rs-6864203/v1
Faustino, B., Lopes, P., Oliveira, J., et al. (2019). Psychometric and Rasch analysis of the UCLA Loneliness Scale-16 in a Portuguese sample of older adults. Psychological Studies, 64, 140–146. https://doi.org/10.1007/s12646-019-00483-5
Fisher, W. (1992). Reliability, separation, strata statistics. Rasch Measurement Transactions, 6(3), 238. https://www.rasch.org/rmt/rmt63i.htm
Fone, D. L., Farewell, D. M., & Dunstan, F. D. (2006). An ecometric analysis of neighbourhood cohesion. Population Health Metrics, 4, 17. https://doi.org/10.1186/1478-7954-4-17
Goldman, N., Alemdar, M., Megges, H., Matsumoto, N., Schoenmakers, E., van den Berg, P., Lasgaard, M., Christiansen, J., Junttila, N., Goldman, A., Draxl, D., El-Osta, A., & Qualter, P. (2026). National policy responses to address loneliness: A global scoping review of 194 WHO member states. Health Policy, 165, 105553. https://doi.org/10.1016/j.healthpol.2025.105553
Goldman, N., Khanna, D., El Asmar, M. L., Qualter, P., & El-Osta, A. (2024). Addressing loneliness and social isolation in 52 countries: A scoping review of national policies. BMC Public Health, 24, 1207. https://doi.org/10.1186/s12889-024-18370-8
Gov.UK. (2023). UK ethnicity facts and figures: Age groups. https://www.ethnicity-facts-figures.service.gov.uk/uk-population-by-ethnicity/demographics/age-groups/latest/
Grootaert, C., Narayan, D., Nyhan Jones, V., & Woolcock, M. (2004). Measuring social capital: An integrated questionnaire. World Bank. https://documents1.worldbank.org/curated/en/515261468740392133/pdf/281100PAPER0Measuring0social0capital.pdf
Guttman, L. (1950). The basis for scalogram analysis. In S. A. Stouffer et al. (Eds.), Measurement and prediction (pp. 60–90). Princeton University Press. https://psycnet.apa.org/record/1951-03037-000
Hagell, P. (2026). Local dependence in health outcome measurement: The case of the 8-item Parkinson’s disease questionnaire (PDQ-8). Educational Methods & Psychometrics, 4, 27. https://doi.org/10.65301/emp.2026.256
Hambleton, R. K., Swaminathan, H., & Rogers, H. J. (1991). Fundamentals of item response theory. Sage.
Hughes, M., Waite, L., Hawkley, L., & Cacioppo, J. (2004). A short scale for measuring loneliness in large surveys: Results from two population-based studies. Research on Aging, 26(6), 655–672. https://doi.org/10.1177/0164027504268574
HM Government. (2023). Loneliness: Annual report (fourth year). https://www.gov.uk/government/publications/loneliness-annual-report-the-fourth-year
Hwang, T. J., Rabheru, K., Peisah, C., Reichman, W., & Ikeda, M. (2020). Loneliness and social isolation during the COVID-19 pandemic. International Psychogeriatrics, 32(10), 1217–1220. https://doi.org/10.1017/S1041610220000988
Igarashi, T. (2019). Development of the Japanese version of the three-item loneliness scale. BMC Psychology, 7, 20. https://doi.org/10.1186/s40359-019-0285-0
Jeffrey, K., Abdallah, S., & Michaelson, J. (2017). The cost of loneliness to UK employers. New Economics Foundation. https://neweconomics.org/2017/02/cost-loneliness-uk-employers
Jopling, K. (2018). Combatting loneliness one conversation at a time: A call to action. Jo Cox Commission on Loneliness. https://www.ageuk.org.uk/globalassets/age-uk/documents/reports-and-publications/reports-and-briefings/active-communities/rb_dec17_jocox_commission_finalreport.pdf
Kelderman, H. (1996). Multidimensional Rasch models for partial-credit scoring. Applied Psychological Measurement, 20(2), 155–168. https://doi.org/10.1177/014662169602000205
Linacre, J. M. (1995). Reliability and separation nomograms. Rasch Measurement Transactions, 9(2), 421. https://www.rasch.org/rmt/rmt92a.htm
Linacre, J. M. (2002). Immediate raw score to logit conversion. Rasch Measurement Transactions, 16(2), 877. https://www.rasch.org/rmt/rmt162.pdf
Linacre, J. M. (2005). The partial credit model and the one-item rating scale model. Rasch Measurement Transactions, 19(1), 1000–1002. https://www.rasch.org/rmt/rmt191e.htm
Linacre, J. M. (2008). The expected value of a point-biserial (or similar) correlation. Rasch Measurement Transactions, 22(1), 1154. https://www.rasch.org/rmt/rmt221e.htm
Linacre, J. M. (2022). Winsteps® Rasch measurement computer program (Version 5.10.4.0). Winsteps.com. https://www.winsteps.com
Lochner, K., Kawachi, I., & Kennedy, B. P. (1999). Social capital: A guide to its measurement. Health & Place, 5(4), 259–270. https://doi.org/10.1016/S1353-8292(99)00016-7
Macdonald, M., & Kulakiewicz, A. (2021). Tackling loneliness (Commons Library Research Briefing). UK Parliament. https://researchbriefings.files.parliament.uk/documents/CBP-8514/CBP-8514.pdf
Maes, M., Qualter, P., Lodder, G. M. A., & Mund, M. (2022). How (not) to measure loneliness: A review of the eight most commonly used scales. International Journal of Environmental Research and Public Health, 19(17), 10816. https://doi.org/10.3390/ijerph191710816
Mansfield, L., Victor, C., Meads, C., Daykin, N., Tomlinson, A., Lane, J., et al. (2021). A conceptual review of loneliness in adults: Qualitative evidence synthesis. International Journal of Environmental Research and Public Health, 18(21), 11522. https://doi.org/10.3390/ijerph182111522
Martin, K. S., Rogers, B. L., Cook, J. T., & Joseph, H. M. (2004). Social capital is associated with decreased risk of hunger. Social Science & Medicine, 58(12), 2645–2654. https://doi.org/10.1016/j.socscimed.2003.09.026
Mokkink, L. B., Elsman, E. B. M., & Terwee, C. B. (2024). COSMIN guideline for systematic reviews of patient-reported outcome measures (Version 2.0). Quality of Life Research, 33, 2929–2939. https://doi.org/10.1007/s11136-024-03761-6
Nyqvist, F., Victor, C. R., Forsman, A. K., & Cattan, M. (2016). The association between social capital and loneliness in different age groups: A population-based study in Western Finland. BMC Public Health, 16, 542. https://doi.org/10.1186/s12889-016-3248-x
Office for National Statistics. (2023, March 31). Age groups. Ethnicity facts and figures. https://www.ethnicity-facts-figures.service.gov.uk/uk-population-by-ethnicity/demographics/age-groups/latest/
O’Neill, A. (2025). Age distribution from 2014 to 2024 in the United Kingdom [Dataset]. Statista. https://www.statista.com/statistics/270370/age-distribution-in-the-united-kingdom/
Osborn, E., Hassell, C., Martin, G., & Cochrane, A. (2018). Testing of loneliness questions in surveys. Office for National Statistics. https://www.ons.gov.uk/peoplepopulationandcommunity/wellbeing/compendium/nationalmeasurementofloneliness/2018/testingoflonelinessquestionsinsurveys
Perlman, D., & Peplau, L. A. (1981). Toward a social psychology of loneliness. In S. Duck & R. Gilmour (Eds.), Personal relationships in disorder (Vol. 3, pp. 31–56). Academic Press. https://peplau.psych.ucla.edu/wp-content/uploads/sites/141/2017/07/Perlman-Peplau-81.pdf
Peytrignet, S., Garforth-Bles, S., & Keohane, K. (2020). Loneliness monetisation report: Analysis for the Department for Digital, Culture, Media & Sport. Simetrica Jacobs. https://assets.publishing.service.gov.uk/media/602fcb91d3bf7f72154fabc3/Loneliness_monetisation_report_V2.pdf
Pond, R. S., Jr., Brey, J., & DeWall, C. N. (2011). Denying the need to belong: How social exclusion impairs human functioning and how people can protect against it. In S. J. Bevinn (Ed.), Psychology of loneliness (pp. 129–148). Nova Science Publishers.
Pyle, E., & Evans, D. (2018). Loneliness: What characteristics and circumstances are associated with feeling lonely. Office for National Statistics. https://www.ons.gov.uk/peoplepopulationandcommunity/wellbeing/articles/lonelinesswhatcharacteristicsandcircumstancesareassociatedwithfeelinglonely/2018-04-10
Rasch, G. (1980). Probabilistic models for some intelligence and attainment tests (Expanded ed.). University of Chicago Press. https://www.rasch.org/books.htm
Rose, A., Abrams, T., Parker, E., & Todres, G. (2021). Evaluation of the Building Connections Fund prior to the Covid-19 pandemic (Part 1). The Building Connections Fund. https://assets.publishing.service.gov.uk/media/6114ef638fa8f53dccf1a92a/BCF_Part_1_evaluation_report_May_2021.pdf
Rudner, L., & Wright, B. D. (1995). Diagnosing person misfit. Rasch Measurement Transactions, 9(2), 430. https://www.rasch.org/rmt/rmt92h.htm
Russell, D. W. (1996). UCLA Loneliness Scale (Version 3): Reliability, validity, and factor structure. Journal of Personality Assessment, 66(1), 20–40. https://doi.org/10.1207/s15327752jpa6601_2
Russell, D. W., Peplau, L. A., & Cutrona, C. E. (1980). The revised UCLA Loneliness Scale: Concurrent and discriminant validity evidence. Journal of Personality and Social Psychology, 39(3), 472–480. https://doi.org/10.1037/0022-3514.39.3.472
Salisu, I., & Hashim, N. (2017). A critical review of scales used in social capital research. IOSR Journal of Business and Management, 19(4), 34–40. https://doi.org/10.9790/487X-1904033440
Sampson, R. J., & Graif, C. (2009). Neighborhood social capital as differential social organization: Resident and leadership dimensions. American Behavioral Scientist, 52(11), 1579–1605. https://doi.org/10.1177/0002764209331527
Sampson, R. J., Raudenbush, S. W., & Earls, F. (1997). Neighborhoods and violent crime: A multilevel study of collective efficacy. Science, 277(5328), 918–924. https://doi.org/10.1126/science.277.5328.918
Scrivens, C., & Smith, C. (2013). Four interpretations of social capital: An agenda for measurement (OECD Working Paper No. 55). OECD. https://doi.org/10.1787/5jzbcx010wmt-en
Shankar, A., Rafnsson, S. B., & Steptoe, A. (2015). Longitudinal associations between social connections and subjective wellbeing in the English Longitudinal Study of Ageing. Psychology & Health, 30(6), 686–698. https://doi.org/10.1080/08870446.2014.979823
Smith, E. V., Jr. (2002). Detecting and evaluating the impact of multidimensionality using item fit statistics and principal component analysis of residuals. Journal of Applied Measurement, 3(2), 205–231.
Snape, D. & Martin, G. (2018). Measuring loneliness: guidance for use of the national indicators on surveys. Office for National Statistics. https://www.ons.gov.uk/peoplepopulationandcommunity/wellbeing/methodologies/measuringlonelinessguidanceforuseofthenationalindicatorsonsurveys
Steptoe, A., Shankar, A., Demakakos, P., & Wardle, J. (2013). Social isolation, loneliness, and all-cause mortality in older men and women. Proceedings of the National Academy of Sciences, 110(15), 5797–5801. https://doi.org/10.1073/pnas.1219686110
Stewart-Brown, S. L., Tennant, A., Tennant, R., Platt, S., Parkinson, J., & Weich, S. (2009). Internal construct validity of the Warwick-Edinburgh Mental Well-being Scale (WEMWBS): A Rasch analysis using data from the Scottish Health Education Population Survey. Health and Quality of Life Outcomes, 7, 15. https://doi.org/10.1186/1477-7525-7-15
Tennant, A., & Conaghan, P. G. (2007). The Rasch measurement model in rheumatology: What is it and why use it? When should it be applied, and what should one look for in a Rasch paper? Arthritis & Rheumatism, 57(8), 1358–1362. https://doi.org/10.1002/art.23108
Tennant, A., & Pallant, J. F. (2006). Unidimensionality matters! (A tale of two Smiths?). Rasch Measurement Transactions, 20(1), 1048–1051. https://www.rasch.org/rmt/rmt201c.htm
Tennant, A., & Pallant, J. F. (2007). DIF matters: A practical approach to test if differential item functioning makes a difference. Rasch Measurement Transactions, 20(4), 1082–1084. https://www.rasch.org/rmt/rmt204d.htm
Tennant, R., Hiller, L., Fishwick, R., Platt, S., Joseph, S., Weich, S., et al. (2007). The Warwick-Edinburgh Mental Well-being Scale (WEMWBS): Development and UK validation. Health and Quality of Life Outcomes, 5, 63. https://doi.org/10.1186/1477-7525-5-63
The Campaign to End Loneliness. (2020). The psychology of loneliness: Why it matters and what we can do. The Campaign to End Loneliness. https://www.campaigntoendloneliness.org/wp-content/uploads/Psychology_of_Loneliness_FINAL_REPORT.pdf
Todres, G., Abrams, T., Parker, E., & Rose, A. (2021). Evaluation of the Building Connections Fund during the Covid-19 pandemic (Part 2). The Building Connections Fund. https://assets.publishing.service.gov.uk/media/6114ef73e90e070540bae10d/BCF_Part_2_evaluation_report_May_2021.pdf
Tristán, L. A. (2019). Theoretical separation and alpha values for objective tests. Rasch Measurement Transactions, 32(3), 1725–1729. https://www.rasch.org/rmt/rmt323.pdf
Tristán, L. A. (2025). Enhancing Cronbach’s alpha applications through the Harmonised V-O-R Framework. Educational Methods & Psychometrics, 3, 4. https://doi.org/10.61186/emp.2025.4
Tristán, L. A., & Vidal, U. R. (2007). Linear model to assess the scale’s validity of a test [Conference presentation]. American Educational Research Association Annual Meeting, Chicago. https://files.eric.ed.gov/fulltext/ED501232.pdf
Trucharte, A., Calderón, L., Cerezo, E., Contreras, A., Peinado, V., & Valiente, C. (2023). Three-item loneliness scale: Psychometric properties and normative data of the Spanish version. Current Psychology, 42, 7466–7474. https://doi.org/10.1007/s12144-021-02110-x
Victor, C. R., Scambler, S. J., Bowling, A., & Bond, J. (2005). The prevalence of, and risk factors for, loneliness in later life: A survey of older people in Great Britain. Ageing & Society, 25(3), 357–375. https://doi.org/10.1017/S0144686X04003332
Waterbury, G. T. (2019). Missing data and the Rasch model: The effects of missing data mechanisms on item parameter estimation. Journal of Applied Measurement, 20(2), 154–166. https://pubmed.ncbi.nlm.nih.gov/31120433/
Welch, V., Tanjong Ghogomu, E., Dowling, S., Choo, W. Y., Yunus, R. M., Mohd, T. A. M. T., et al. (2023). In-person interventions to reduce social isolation and loneliness: An evidence and gap map (Protocol). Campbell Systematic Reviews, 19(3), e1340. https://doi.org/10.1002/cl2.1340
World Health Organization. (2021). Social isolation and loneliness among older people: Advocacy brief. https://www.who.int/publications/i/item/9789240030749
Wright, B. D. (1992). IRT in the 1990s: Which models work best? 3PL or Rasch? Rasch Measurement Transactions, 6(1), 196–200. https://www.rasch.org/rmt/rmt61a.htm
Wright, B. D. (1996a). Local dependency, correlations and principal components. Rasch Measurement Transactions, 10(3), 509–511. https://www.rasch.org/rmt/rmt103b.htm
Wright, B. D. (1996b). Reliability and separation. Rasch Measurement Transactions, 9(4), 472. https://www.rasch.org/rmt/rmt94n.htm
Wright, B. D. (1998). Model selection: Rating scale model (RSM) or partial credit model (PCM)? Rasch Measurement Transactions, 12(3), 641–642. https://www.rasch.org/rmt/rmt1231.htm
Wright, B. D. (2001). Separation, reliability and skewed distributions: Statistically different sample-independent levels of performance. Rasch Measurement Transactions, 14(4), 786. https://www.rasch.org/rmt/rmt144k.htm
Wright, B. D., & Masters, G. N. (1982). Rating scale analysis. Mesa Press. https://www.rasch.org/books.htm
Wright, B. D., & Stone, M. H. (1979). Best test design. Mesa Press. https://www.rasch.org/books.htm
Wright, B. D., & Stone, M. H. (2004). Making measures. The Phaneron Press. https://rasch.org/BTD_RSA/pdf/Making%20Measures.pdf
Wu, B. (2020). Social isolation and loneliness among older adults in the context of COVID-19: A global challenge. Global Health Research and Policy, 5, 27. https://doi.org/10.1186/s41256-020-00154-3
Yanguas, J., Pinazo-Hernandis, S., & Tarazona-Santabalbina, F. J. (2018). The complexity of loneliness. Acta Biomedica, 89(2), 302–314. https://doi.org/10.23750/abm.v89i2.7404
Yen, W. M. (1984). Effects of local item dependence on the fit and equating performance of the three-parameter logistic model. Applied Psychological Measurement, 8(2), 125–145. https://doi.org/10.1177/01466216840080020
Manuscript Received: 18 NOV 2025
Final Version Received: 27 FEB 2026
Published Online Date: 15 MAR 2026
