Full Html
Full Html
1 | Introduction
Over the last few decades, different successful models of professional development (e.g., Berry et al., 2004; Jiang, 2016; Kager et al., 2023; Tabatabaee-Yazdi et al., 2017, 2018) have been proposed to direct the attention of educational experts, trainers, and teachers towards the improvement of educational contexts and the growth of teachers. The models primarily focus on changing individual teachers' practices, beliefs, and knowledge by highlighting the role of high-quality, sustained, and intensive workshops, courses, and seminars for enhancing teachers' content knowledge and methodologies. While these changes have been in improving the research community's understanding of the several aspects of effective teaching and learning, they involved training teachers to apply a specific method or some teaching techniques and strategies, which are typically unfamiliar to teachers and generally ineffective in developing their teaching methods (Harris & Anthony, 2001). As argued by Lieberman and Miller (1999, p. 5), such attempts are more likely to fail as they "infantilize teachers and push them into patterns of defensiveness and conservatism" (p. 5). For that reason, Khourey-Bowers et al. (2005, p. 3) argue that it is time to move forward into the next generation of professional development, where the focus of change is extended to the teachers' professional community.
According to Khourey-Bowers et al. (2005), the next generation of professional development must attempt to reconsider the underlying structure of the school culture, which operationally denotes the collective professional interactions, behaviors, and resources employed by the school community in making an effective learning environment. Unlike traditional teacher development which regarded teachers as professionals and active inquirers who can take responsibility for their own learning, the new generation of teacher development is focused and highly encourages teachers to collaborate and jointly solve problems related to teaching (Harris & Anthony, 2001). This perspective is totally in line with the view of constructivist teaching which involves students in the classroom (Astleitner, 2021).
An important aspect of promoting the school culture and improving teacher development is the notion of collegiality. As defined by Grünberg and Armellini (2004), "collegiality is viewed as attending to the work of others, engaging in intellectual reciprocity, providing timely feedback to colleagues, being open to peer review of teaching and sharing new ideas and teaching materials with colleagues" (p. 598). This definition emphasizes a shift from traditional isolated and autonomous peer relationships to greater collegial relationships and collaboration. Chen and Rong (2023) notes that collegial relationships among educators for the purpose of growing a professional learning community can occur due to talking with one another about practice, sharing their craft knowledge, observing one another while they are engaged in practice, and rooting for one another's success.
Collaboration and interaction have a central role in the work of educators. They help educators to share different issues with their peers such as their experiences, knowledge, and feelings (Desta et al., 2023). Researchers have also emphasized that educators should listen and react to each other, provide feedback to each other, and take others' ideas and suggestions into consideration (Chiang et al., 2011; Koskenranta et al., 2022a).
Research has also indicated that strong collegial relationships have a critical role in school success and improvement as well as professional development (Dawson et al., 2022). Previous studies have argued that collegiality is essential for effective teaching and learning, as it allows both students and teachers to share ideas, knowledge, resources, and expertise (Astleitner & Zumbach, 2023; Dawson et al., 2022). Collegial relationships among teachers allow them to create a supportive and positive work environment, which can lead to increased teacher morale, alleviation of burnout, job satisfaction, and commitment to work (Shah, 2012).
Along the same lines, a number of researchers have argued that age and gender have a great impact on teachers' collegiality in educational settings (Astleitner & Zumbach, 2023; Hargreaves, 1994; Shah, 2012). Younger and less experienced teachers have been shown to have a greater tendency to be collaborative or have collegial relationships compared to their older and more experienced peers. This tendency among younger teachers could be due to a set of factors, including receiving training in collaborative settings, being motivated to make a difference, and being open to new ideas (Hargreaves, 1994). The divergence between less and more experienced teachers could be also attributed to teaching experiences, work satisfaction, and possibilities for professional development. Hargreaves (1994), nevertheless, emphasizes that a large number of older or more experienced teachers are highly collaborative; they have more experience and a deep understanding of the challenges of teaching. They are thus more likely to interact with young teachers to share their experiences over time. Researchers have also indicated that female teachers tend to create more collegial relationships with their peers compared to their male counterparts (Astleitner & Zumbach, 2023).
Furthermore, a great deal of research has been conducted to investigate the role of collegiality in professional development and the growth of teachers in educational contexts (Chen & Rong, 2023; Dawson et al., 2022; Desta et al., 2023; Esterhazy et al., 2021; Hashimoto & Maeda, 2021; Kardos & Johnson, 2007; Kardos et al., 2001; Ross & Gray, 2006). However, closer scrutiny of the literature on collegiality discloses that there is a dearth of empirical studies on this construct in the field of second/foreign (L2) education. Numerous researchers have sporadically examined the role of collegiality within the context of L2 education and indicated that teachers' collegial relationships are a source of satisfaction and growth (Cowie, 2011; Han et al., 2023; Karagianni & Papaefthymiou-Lytra, 2018). Most previous studies were mainly based on qualitative methods, where researchers used interviews and observation to collect information. The rationale for the scarcity of research in EFL contexts is due to the lack of a precisely calibrated scale. Although numerous researchers have already developed some measures to quantify collegiality in different fields, such as educational sciences, government, and social and health care (Astleitner, 2021; dos Santos et al., 2020; Koskenranta et al., 2022a, 2022b; Shah & Abualrob, 2012), the construct of teachers' collegiality has not been already defined in its operational terms to help researchers to quantify it in L2 educational contexts, mainly due to the lack of any scale for measuring collegiality in the field. Therefore, the development of a new scale for L2 educational contexts will allow researchers to study and understand collegiality as it provides a foundation for collaboration and support (Alleman et al., 2017).
2 | The Current Study
The purpose of the present study was to develop and validate a new scale for assessing EFL teachers' collegiality competence using an item response theory (IRT) model. Unlike classical test theory (CTT) which assumes that all items in a measurement scale make an equal contribution to the performance of respondents irrespective of their trait levels, IRT takes into account the characteristics of items and latent variable value (Reise & Haviland, 2005). In fact, IRT models are a family of mathematical models that attempt to account for the association between latent traits (unobservable characteristics or attributes) and their manifestations (i.e., observed outcomes, responses, or performance) (Hambleton & Swaminathan, 1985). The probability of getting an item right or endorsing a response category is assumed to be a function of both the trait level of a respondent and a set of item characteristics. Respondents with higher levels of the expected latent trait have greater probabilities to respond correctly to a given item or endorse higher response categories.
All IRT models include three important assumptions. The first assumption is monotonicity stating that the probability of success or endorsing a higher category increases if the level of the intended trait increases. The second assumption is local independence stating that respondents' item responses to items of a scale are independent regarding a certain level of the intended trait. The third assumption is unidimensionality indicating that all items of a scale should only measure a latent trait. In fact, unidimensionality indicates that a single latent trait explains variability in the data. This is an important requirement for measurement as a scale intending to measure varying levels of a latent trait should not be affected by different levels of a secondary construct (Stout, 1987). The utility of IRT models helps researchers to develop optimal scales, give standard errors of measurement for item difficulties and different ability/trait levels of respondents, and evaluate items in more detail (Doebler & Holling, 2016). For the purpose of the present study, the following research questions were posed:
Q1: Does the teachers' collegiality scale yield psychometrically reliable scores to assess EFL teachers' collegiality
competence?
Q2: Does the teachers' collegiality scale yield psychometrically valid scores to assess EFL teachers' collegiality
competence?
Q3: Is there any significant difference between Iranian EFL teachers in teachers' collegiality regarding their gender?
Q4: Is there any significant relationship between Iranian EFL teachers' collegiality and their age?
3 | Method
3.1 | Development of the Scale
To develop a valid and reliable scale for assessing collegiality of EFL teachers, a comprehensive review of the related literature was carried out, and a pool of 66 items was developed. We used a five-point Likert scale: 1 (strongly disagree), 2 (disagree), 3 (neutral), 4 (agree), and 5 (strongly agree). The items were undertaken with a two-stage analysis. In the first stage, those items that overlapped or were mere repetitions of one another were removed, reducing the list of items to 59.
In the next stage, to check the readability, clarity, redundancy, and content validity of the developed items (Dörnyei, 2003), four content experts familiar with the concept of collegiality, with at least ten years of experience in English teaching methodologies and applied linguistics, were asked to review the pool and discuss their opinions in different sessions. The expert analysis of the scale further polished the scale and led to its shorter version (including 45 items). The remaining items passing the judgment of the experts were piloted on a group of 42 English teachers. Ambiguous items with respect to content, format, and wording were identified and removed from the scale. Confusing items were also reworded, leaving 45 items assessing collegiality of EFL teachers. The degree of reliability for the scale with 45 items was investigated, and a high Cronbach’s alpha reliability of the scale was obtained (0.95).
3.2 | Data Collection and Instrument
The participants of this study were a convenient sample of 202 EFL teachers from different schools and institutes located in the Northeast of Iran. Of the total sample, there were 51 (25.2%) male and 151 (74.8%) female teachers. The ages of these participants ranged from 18 to 49 (M = 25.86; SD = 6.06). The data collection procedure began in Spring 2023. Participants were instructed to carefully read each item of the scale and mark which descriptive rating best described their beliefs. They were reassured that their information would remain confidential and anonymous. No item required reverse scoring, and higher scores showed higher levels of collegiality.
3.3 | Data Analysis
The data were analyzed using the WINSTEPS 32 computer package, Version 3.73 (Linacre, 2009a). To evaluate the psychometric properties of the newly-developed scale, the Rasch model (Rasch, 1960/1980) was used. The Rasch model is a latent trait model upon which the probability of endorsing an item is modeled as a logistic function of the difference between the person and item parameters. Respondents with higher abilities (or higher level of the expected latent trait) relative to the difficulty level of items have higher probabilities of endorsing the items. When the location of a respondent on the latent trait is equal to the difficulty level of an item, there is by definition a 0.5 probability of getting the item right or endorsing a response option in the Rasch model. The relationship between the ability (????) level of a respondent and the probability of a correct response or endorsing a response option is graphically represented in a set of graphs known as item characteristic curves (ICCs). Compared to other statistical methods, the Rasch model addresses a set of psychometric properties of test measures. An important property of the model is that it converts ordinal person and item raw scores into interval-scaled measures by locating respondents and items on a continuum on which the location of persons and items corresponds to their ability and difficulty (or endorsability) measures. It also allows researchers to identify construct-underrepresentation and provides information on the function of response categories and the thresholds between them. Regarding these advantages, the Rasch was used in this study to investigate the psychometric characteristics of the scale. For instruments with polytomous items, the rating scale model (RSM; Andrich, 1978) is used. The RSM is an extension of the dichotomous Rasch model which assumes that all items of a scale have a similar rating scale structure.
Item difficulties indicate the degree of difficulty with which the item is endorsed and show the location of items on the latent trait continuum explaining in logits. Difficult items are marginally endorsable, whereas easy items are highly endorsable. The error of measurement indicates the degree to which the item difficulties were precisely estimated. The Rasch model also generates reliability coefficients for items and persons, and separation indices. Separation reliability is the ratio of the person or item true standard deviation to the error standard deviation (e.g., root mean square error (RMSE)). It indicates to what extent item and person parameters are separated on the latent trait (Linacre, 2009b). High reliability of items or persons suggests that there is a high probability that items or persons estimated with high measures actually do have higher measures than items or persons estimated with low measures. Low person/item reliability measures show that the items and respondents are homogeneous, and the scale fails to distinguish among low- and high-level respondents (Linacre, 2009b). A heterogeneous sample is thus required to improve the reliability coefficients (Engelhard, 2012).
To examine the fit of the data to the model, two kinds of mean square (MNSQ) fit statistics were computed (Linacre, 2002): outfit mean square (OUTFIT MNSQ) is “an outlier sensitive fit statistic, more sensitive to unexpected behavior by persons on items far from the person's measure level”, and infit MNSQ is “an information weighted fit statistic, which is more sensitive to unexpected behavior affecting responses to items near the person's measure level” (pp. 331-332). High values of infit MNSQ show that items are mis-performing for the respondents on whom the items are targeted. This is a major threat to validity, but more difficult to diagnose than high outfit (Linacre, 2009b, p. 596). The two statistics indicate to what extent the items of the scale reflect the single underlying latent trait intended to be measured. The optimal range for MNSQ values is between 0.60 and 1.4 (Bond et al., 2021). The point-measure correlations for all items were also estimated to measure the agreement of observed scores with the latent trait. Point-biserial (or point-measure) correlations show the extent to which the responses to each item of a scale correlate with the overall measure. A distinctive feature of the Rasch model is that it expresses person ability and item difficulty estimates on the same scale, and they are comparable. The relationships between items and persons are illustrated on an item-person map, known as Wright map, which arranges item difficulties and persons' abilities along a single latent trait line calibrated in logits.
Finally, the thresholds between response categories were examined. This statistic represents the equal probability between two adjacent categories (Lincacre, 2009b, p. 519). In other words, thresholds refer to locations on the latent trait continuum where the probability of endorsing a category and the adjacent category is equal (Linacre, 2009b). The estimates of thresholds indicate both the adequacy of the number of categories and the distinctiveness of each step on a Likert-type scale. With category values, it is expected that threshold estimates increase, that is, respondents with a higher level of the expected latent trait are expected to endorse higher categories. As Linacre (2004) argued, the rating category and threshold difficulty measures should increase monotonically by at least 1.1 logits (log-odd units). Following Linacre's (2004) suggestion, the MNSQ values should be between 0.6 and 1.4. A visual illustration of the probability curves for each response category was also checked.
4 | Results
4.1 | Preliminary Analyses
We computed descriptive statistics for the scale data, including mean, standard deviation (SD), skewness, and kurtosis using SPSS for Windows, Version 23 (SPSS Inc., Chicago, IL). As Table 1 presents, item means varied from 3.53 to 4.53; the higher the item mean, the easier respondents found it to agree with the item. A low SD indicates that data is inclined to be close to the mean, and a high SD shows a high deviation from the mean. Items 29 (M = 4.53, SD = 0.647, total score = 916) and 30 (M = 4.53, SD = 0.706, total score = 915) have the highest mean scores, whereas Items 22 (M = 3.53, SD = 1.003, total score = 713) and 23 (M = 3.60, SD = 0.860, total score = 727) have the lowest. The values of skewness and kurtosis also fell within the accepted range (±2), suggesting that the data is normally distributed.
To check the internal consistency of the scale, the Cronbach’s alpha was computed, and the value of 0.95 was obtained, showing very good internal consistency reliability for the scale with this sample. We also analyzed item-total statistics for the scale. All values of the corrected item-total correlation were above 0.30, showing that items are measuring the same variable.
4.2 | Individual Item Characteristics and Unidimensionality
Table 1 displays item difficulty estimates, standard error of measurement, mean square (MNSQ) statistics, and point-measure correlations. As can be seen, item difficulties varied from -1.45 to 0.98 logits with a separation and item reliability of 4.69 and 0.96, respectively. Item 29 was the easiest item, and Item 22 was the most difficult item. Person parameters further varied from -0.79 to 6.48 with a separation and person reliability of 4.01 and 0.94, respectively. The results indicate that the scale discriminates well among respondents with varying levels of the trait; respondents with low levels of collegiality possess lower levels of the latent trait, and respondents with higher scores possess higher levels of the trait. High values of separation indices also verify that almost 4.01 and 4.69 latent trait levels and endorsability are recognizable among respondents and items.
The quality of the items was analyzed using infit and outfit MNSQ statistics. As can be seen in Table 1, except for four poor items (e.g., 9, 11, 22, and 34), the values of outfit and infit MNSQ are within the acceptable boundary of 0.6 and 1.4 for measuring rating scales (Bond et al., 2021; Linacre, 2002). The misfit of the four items suggests that the patterns of item difficulties do not accord with the expectations of the Rasch model, and this is an instance of multidimensionality or the presence of construct-irrelevant variance in the data. Furthermore, the results of point-measure correlations showed that all correlations were higher than 0.30 (Linacre, 2002).
Table 1
Item Characteristics and Fit Statistics for the Scale
Items | Mean | Standard Deviation | Skewness | Kurtosis | Item Difficulty | Standard Error of Measurement | Infit MNSQ | Outfit MNSQ | Point-measure Correlation |
1 | 4.26 | 0.700 | -0.842 | 1.538 | -0.58 | 0.12 | 0.86 | 0.82 | 0.58 |
2 | 4.33 | 0.742 | -1.358 | 3.235 | -0.79 | 0.12 | 1.26 | 1.20 | 0.46 |
3 | 4.13 | 0.644 | -0.243 | -0.159 | -0.25 | 0.11 | 0.77 | 0.78 | 0.54 |
4 | 3.91 | 0.818 | -0.551 | 0.259 | 0.26 | 0.10 | 0.97 | 1.00 | 0.54 |
5 | 4.10 | 0.766 | -0.706 | 0.792 | -0.17 | 0.11 | 1.15 | 1.23 | 0.43 |
6 | 3.77 | 0.792 | -0.288 | -0.270 | 0.55 | 0.10 | 1.06 | 1.18 | 0.42 |
7 | 3.62 | 0.790 | -0.323 | 0.059 | 0.82 | 0.09 | 1.08 | 1.32 | 0.37 |
8 | 3.80 | 0.749 | -0.511 | 0.252 | 0.49 | 0.10 | 0.76 | 0.80 | 0.55 |
9 | 3.95 | 0.896 | -0.656 | -0.020 | 0.18 | 0.10 | 1.43* | 1.61* | 0.41 |
10 | 4.13 | 0.800 | -0.884 | 0.978 | -0.24 | 0.11 | 1.09 | 1.13 | 0.51 |
11 | 4.00 | 0.878 | -0.811 | 0.171 | 0.05 | 0.11 | 1.50* | 1.55* | 0.39 |
12 | 3.88 | 0.909 | -0.637 | 0.105 | 0.33 | 0.10 | 1.07 | 1.04 | 0.59 |
13 | 4.15 | 0.829 | -1.087 | 1.583 | -0.30 | 0.11 | 1.18 | 1.10 | 0.55 |
14 | 4.11 | 0.690 | -0.421 | 0.107 | -0.19 | 0.11 | 0.83 | 0.90 | 0.52 |
15 | 3.65 | 0.677 | -0.019 | 0.378 | 0.77 | 0.09 | 0.74 | 0.77 | 0.50 |
16 | 4.19 | 0.667 | -0.445 | 0.085 | -0.40 | 0.11 | 0.82 | 0.83 | 0.52 |
17 | 4.13 | 0.724 | -0.764 | 0.917 | -0.25 | 0.11 | 0.74 | 0.76 | 0.62 |
18 | 4.12 | 0.779 | -0.858 | 1.437 | -0.23 | 0.11 | 1.06 | 1.09 | 0.51 |
19 | 3.99 | 0.852 | -1.004 | 1.474 | 0.09 | 0.11 | 1.13 | 1.11 | 0.55 |
20 | 3.95 | 0.940 | -1.027 | 1.120 | 0.18 | 0.10 | 1.15 | 1.05 | 0.61 |
21 | 3.96 | 0.800 | -1.098 | 2.208 | 0.17 | 0.10 | 0.89 | 0.89 | 0.58 |
22 | 3.53 | 1.003 | -0.560 | -0.025 | 0.98 | 0.09 | 1.36 | 1.46* | 0.45 |
23 | 3.60 | 0.860 | -0.358 | 0.183 | 0.86 | 0.09 | 0.90 | 0.94 | 0.56 |
24 | 3.98 | 0.861 | -1.087 | 1.802 | 0.12 | 0.10 | 0.93 | 0.89 | 0.63 |
25 | 3.96 | 0.778 | -0.763 | 1.004 | 0.15 | 0.10 | 0.72 | 0.70 | 0.65 |
26 | 3.56 | 0.961 | -0.389 | -0.416 | 0.92 | 0.09 | 1.25 | 1.27 | 0.50 |
27 | 3.95 | 0.865 | -0.873 | 0.835 | 0.19 | 0.10 | 1.04 | 1.00 | 0.58 |
28 | 3.94 | 0.792 | -0.491 | -0.035 | 0.21 | 0.10 | 0.79 | 0.81 | 0.62 |
29 | 4.53 | 0.647 | -1.185 | 0.744 | -1.45 | 0.13 | 1.08 | 0.95 | 0.49 |
30 | 4.53 | 0.706 | -1.431 | 1.503 | -1.43 | 0.13 | 1.32 | 1.09 | 0.48 |
31 | 3.92 | 0.845 | -0.788 | 1.044 | 0.25 | 0.10 | 0.96 | 0.93 | 0.58 |
32 | 4.17 | 0.754 | -0.641 | 0.082 | -0.34 | 0.11 | 0.81 | 0.78 | 0.63 |
33 | 4.06 | 0.853 | -0.756 | 0.322 | -0.08 | 0.11 | 1.06 | 1.07 | 0.60 |
34 | 3.60 | 1.098 | -0.621 | -0.259 | 0.85 | 0.09 | 1.49* | 1.59* | 0.51 |
35 | 4.18 | 0.857 | -1.262 | 2.073 | -0.36 | 0.11 | 1.38 | 1.29 | 0.50 |
36 | 4.24 | 0.757 | -1.063 | 1.746 | -0.53 | 0.12 | 1.03 | 0.96 | 0.57 |
37 | 4.18 | 0.835 | -1.080 | 1.445 | -0.38 | 0.11 | 1.22 | 1.15 | 0.56 |
38 | 4.12 | 0.716 | -0.507 | 0.125 | -0.21 | 0.11 | 0.74 | 0.73 | 0.63 |
39 | 4.05 | 0.734 | -0.390 | -0.194 | -0.06 | 0.11 | 0.71 | 0.73 | 0.65 |
40 | 4.29 | 0.676 | -0.919 | 2.131 | -0.67 | 0.12 | 0.75 | 0.71 | 0.62 |
41 | 4.13 | 0.784 | -0.804 | 0.856 | -0.25 | 0.11 | 0.89 | 0.80 | 0.64 |
42 | 4.15 | 0.773 | -0.859 | 1.086 | -0.30 | 0.11 | 1.05 | 1.04 | 0.54 |
43 | 3.87 | 0.806 | -0.509 | -0.017 | 0.34 | 0.10 | 0.94 | 0.94 | 0.56 |
44 | 3.67 | 0.818 | -0.048 | -0.286 | 0.73 | 0.10 | 0.88 | 0.96 | 0.56 |
45 | 4.05 | 0.758 | -0.498 | -0.021 | -0.05 | 0.11 | 0.88 | 0.88 | 0.57 |
Mean | - | - | - | - | 0.00 | 0.11 | 1.02 | 1.02 | - |
SD | - | - | 0.54 | 0.01 | 0.22 | 0.23 | - |
Note. * indicates misfitting items; MNSQ = Mean Square
After five rounds of analyzing and removing the misfitting items (i.e., 2, 4, 5, 6, 7, 9, 10, 11, 13, 22, 26, 30, 34, 35, and 37), the quality of the individual items was examined again (see Appendix for the final items). As illustrated in Table 2, the results revealed that item difficulties ranged from -1.61 to 1.04 logits with a separation and item reliability of 3.48 and 0.92, respectively. Person parameters varied from -0.91 to 6.47 with a separation and person reliability of 3.59 and 0.93, respectively. Infit and outfit MNSQ values were also within the ideal range. This indicates that the patterns of item difficulties match the expectations of the Rasch model, and there is no construct-irrelevant variance in the data. The adequate data-model fit provides an indication that all items of the scale measure one construct, suggesting the unidimensionality of the scale. Finally, the values of point-measure correlations for all the items were greater than 0.30. The Cronbach's alpha reliability of the scale with 30 items was 0.94.
Table 2
Item Characteristics and Fit Statistics for the Scale After Removing the Misfitting Items
Items | Item Difficulty | Standard Error of Measurement | Infit MNSQ | Outfit MNSQ | Point-measure Correlation |
1 | -0.63 | 0.12 | 0.96 | 0.91 | 0.58 |
2 | DELETED | ||||
3 | -0.26 | 0.12 | 0.90 | 0.89 | 0.54 |
4 | DELETED | ||||
5 | DELETED | ||||
6 | DELETED | ||||
7 | DELETED | ||||
8 | 0.61 | 0.11 | 0.95 | 1.04 | 0.53 |
9 | DELETED | ||||
10 | DELETED | ||||
11 | DELETED | ||||
12 | 0.42 | 0.11 | 1.25 | 1.21 | 0.58 |
13 | DELETED | ||||
14 | -0.19 | 0.12 | 0.95 | 1.02 | 0.53 |
15 | 0.94 | 0.10 | 0.88 | 0.94 | 0.51 |
16 | -0.43 | 0.12 | 0.95 | 0.97 | 0.52 |
17 | -0.26 | 0.12 | 0.86 | 0.87 | 0.60 |
18 | -0.23 | 0.12 | 1.19 | 1.28 | 0.52 |
19 | 0.14 | 0.11 | 1.29 | 1.24 | 0.55 |
20 | 0.24 | 0.11 | 1.28 | 1.16 | 0.61 |
21 | 0.23 | 0.11 | 0.96 | 0.97 | 0.60 |
22 | DELETED | ||||
23 | 1.04 | 0.10 | 1.00 | 1.05 | 0.59 |
24 | 0.18 | 0.11 | 1.01 | 0.96 | 0.64 |
25 | 0.21 | 0.11 | 0.83 | 0.80 | 0.64 |
26 | DELETED | ||||
27 | 0.25 | 0.11 | 1.18 | 1.11 | 0.58 |
28 | 0.28 | 0.11 | 0.90 | 0.92 | 0.62 |
29 | -1.61 | 0.14 | 1.18 | 1.01 | 0.48 |
30 | DELETED | ||||
31 | 0.33 | 0.11 | 1.07 | 1.06 | 0.59 |
32 | -0.36 | 0.12 | 0.91 | 0.87 | 0.63 |
33 | -0.06 | 0.12 | 1.22 | 1.23 | 0.59 |
34 | DELETED | ||||
35 | DELETED | ||||
36 | -0.58 | 0.12 | 1.15 | 1.07 | 0.56 |
37 | DELETED | ||||
38 | -0.21 | 0.12 | 0.83 | 0.83 | 0.63 |
39 | -0.03 | 0.12 | 0.76 | 0.75 | 0.66 |
40 | -0.74 | 0.13 | 0.81 | 0.74 | 0.62 |
41 | -0.26 | 0.12 | 0.98 | 0.88 | 0.63 |
42 | -0.31 | 0.12 | 1.16 | 1.12 | 0.56 |
43 | 0.44 | 0.11 | 1.05 | 1.13 | 0.57 |
44 | 0.88 | 0.10 | 0.98 | 1.08 | 0.58 |
45 | -0.02 | 0.12 | 0.98 | 1.10 | 0.58 |
Mean | 0.00 | 0.12 | 1.01 | 1.01 | - |
SD | 0.53 | 0.01 | 0.15 | 0.14 | - |
Note. MNSQ = Mean Square
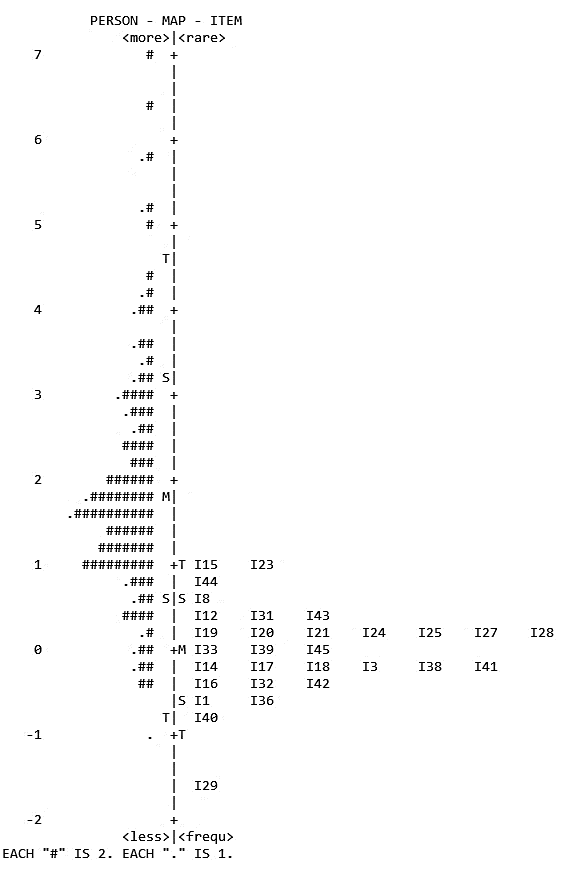
Figure 1 shows the distribution of persons and item difficulty estimates, referred to the Wright map, on the expected construct. Each dot mark (.) indicates 1 person, and each hash mark (#) shows 2 persons. On both sides of the continuum line, S and T are 1 and 2 standard deviations from the mean, respectively, and M is the mean. Persons at the upper part of the continuum are those with higher level of collegiality and persons at the lower part of the continuum are those with lower level of collegiality. As can be seen, the levels of participants are higher than the difficulty level of the items, and more items are required to be inserted into the scale to cover the upper part of the scale.
Figure 1
Wright Map of the Distributions of Items and Persons on the latent Trait
4.3 | Response Scale Analyses
When analyzing rating scales, the order of the thresholds for items should be examined. Table 3 presents the properties of the rating scale structure of the newly-developed scale. The first column shows the number of categories ranging from 1 to 5. The second column demonstrates the observed count and percentage of each category. A large number of respondents selected categories 4, 5, 3, 2, and 1, respectively, suggesting high levels of collegiality among teachers. The third column indicates the category observed average. This is the mean of all respondents in the data who selected that category. It is expected that with category values, observed averages increase. As can be seen, except for Category 2, the pattern of observed averages is satisfactory. Columns 4 and 5 present the average of infit and outfit MNSQ for each category level. The values showed that all categories were within the acceptable boundary. Finally, the last column gives the Andrich thresholds for each category. As can be seen, although threshold estimates indicate the ordering of thresholds (e.g., the categories are ordered), the distance between the second and third categories are very close (e.g., less than 1.1 logits). In this case, a solution is to merge these two categories (Linacre, 2004).
Table 3
Category Statistics for the Final Version of the Scale
Category | Count % | Observed average | Infit MNSQ | Outfit MNSQ | Threshold |
1 | 36(1%) | 0.30 | 1.39 | 1.38 | - |
2 | 200(3%) | 0.22 | 1.11 | 1.17 | -1.92 |
3 | 1038(17%) | 0.76 | 0.99 | 1.03 | -1.20 |
4 | 3067(51%) | 1.66 | 0.86 | 0.82 | 0.15 |
5 | 1719(28%) | 3.29 | 1.00 | 0.96 | 2.98 |
Note. MNSQ = Mean Square
Figure 2 provides a graphical illustration of the probability of curves for each category. All categories are expected to shape a plot like a range of hills. More thoroughly, each category becomes more probable than any of the other categories to be observed based on respondents’ levels of the latent variable. As illustrated in Figure 2, all of the categories work properly and have a peak; each indicates some regions of the dimension which are the most probable response options for respondents in these areas.
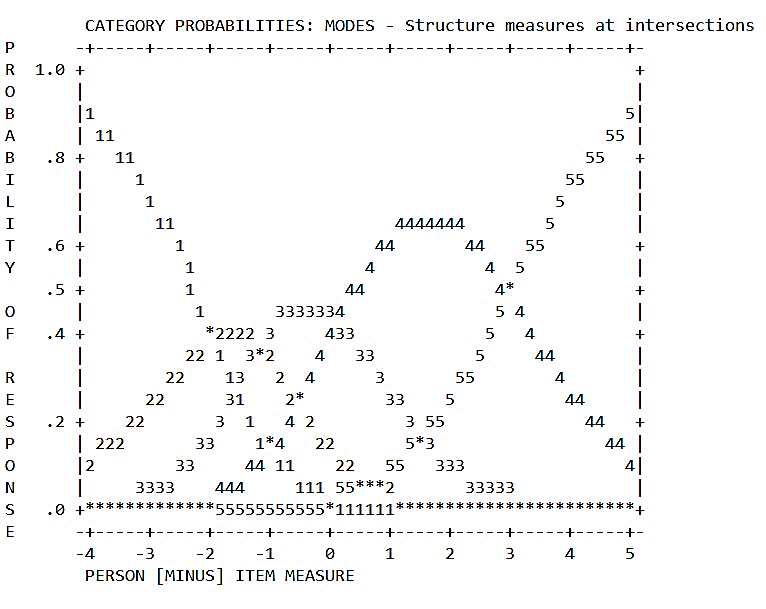 Figure 2
Category Probability Curves for the Scale
4.4 | Further Analyses
An independent-samples t-test was conducted to compare the total scores for males and females. The variances for the two groups were the same as the significance level of Levene’s test was 0.16 which is larger than 0.05. The analysis of differences between the groups showed that there is not a significant difference in scores for males (M = 176.92, SD = 17.400) and females (M = 181.60, SD = 20.980; t (200) = -1.433, p = 0.153, two-tailed). The magnitude of the difference in the means (mean difference = -4.674, 95% CI: -11.108 to 1.759) was small (eta squared = 0.010).
The relationship between EFL teachers' collegiality and their age was also investigated using the Pearson product-moment correlation coefficient. The results showed that there was a low, negative correlation between the two variables, (r = -0.142, n = 202, p < 0.05).
5 | Discussion
Although collegiality is considered one of the most salient aspects of teacher development, no validated scale has been designed for its measurement. This study was an attempt to develop and investigate the psychometric properties of a new scale for assessing EFL teachers' collegiality using RSM, a polytomous IRT model. The scale was designed on the basis of a comprehensive relevant literature review. Several rounds of content analysis on the scale were conducted to enhance its content representation. The judgment of a group of content experts and the feedback of respondents on the scale were also sought to identify any possible sources of confusion and cultural bias. Different iterative sessions were performed to allow content experts to discuss different aspects of the scale. Multiple items with difficulty in understanding were rephrased, and the last version of the scale was administered to a sample of 202 Iranian EFL teachers. Internal consistency estimates and results of RSM yielded high item and person reliability values and offered further content-related evidence of validity (American Educational Research Association [AERA], American Psychological Association [APA], & National Council on Measurement in Education [NCME], 2014). After the pilot study and using RSM analysis, several items were deleted to improve the psychometric quality and content representation of the scale.
We also provided substantive validity evidence for the scale which addresses the relationship between the latent trait and the observed scores. This validity evidence was supported by good fit of the data to the Rasch model, item characteristics, and the features of the rating scale (Yamashita, 2022). The analyses of rating categories revealed that they were selected by at least 10 respondents, indicating that all rating categories contributed to the observed variance in the data (Bond et al., 2021). Furthermore, the response categories showed a monotonic increase in magnitude; with the increased level of the respondents' trait level, the probability of endorsing higher response categories increased as well. However, it must be noted that the distance between Categories 2 and 3 were less than 1.1 logits, so they need to be merged. Finally, the last column gives the Andrich thresholds for each category. As can be seen, although threshold estimates indicate the ordering of thresholds (e.g., the categories are ordered), the distance between the second and third categories are very close (e.g., less than 1.1 logits). In this case, a solution is to merge these two categories (Linacre, 2004). Higher and lower scores also corresponded to higher and lower latent trait levels, respectively, since no unexpected pattern was observed (Bond et al., 2021). The analysis of the fit of the data to the model also showed the adequate data-model fit, indicating an agreement between observed response patterns and RSM expectations. This provides empirical evidence for the unidimensionality as well as the substantive validity of the scale. Overall, substantive evidence is provided for the newly-developed scale (American Educational Research Association [AERA], American Psychological Association [APA], & National Council on Measurement in Education [NCME], 2014), which is a measure of EFL teachers' collegiality.
Furthermore, it turned out that there is a low negative correlation between EFL teachers' collegiality and their age. This finding is in disagreement with previous studies (e.g., Afolabi, 2014; Astleitner & Zumbach, 2023; Olsen & Gebremariam, 2022) which reported a positive moderate to high correlation between teachers' collegiality and their age. However, Hargreaves (1994) argues that younger teachers are more likely to be collaborative than older teachers. He attributes this to a number of factors, including younger teachers having been trained in collaborative settings, being motivated by a desire to make a difference, and being open to new ideas. Hargreaves (1994), nevertheless, acknowledges that there are some older teachers who are highly collaborative. These teachers are often more experienced and have a deep understanding of the challenges of teaching. They are also more likely to have built relationships with their colleagues over time.
One possible reason for the disagreement between the findings of the present research and previous studies could be due to the context of Iran in which older and more experienced teachers are usually not interested in interacting with younger and less experienced teachers. This poor collegial relationship among teachers has always been a main reason for teacher burnout in EFL contexts. A number of researchers have shown that collegiality is affected by one's level of burnout in the workplace, caused by work and personal factors (Adkins, 1995; Day & Leiter, 2014; Smetackova et al., 2021).
Finally, it was found that there is not a significant difference between males and females in their collegiality total scores. This indicates that gender does not play a significant role in EFL teachers' collegiality competence. This finding diverges from the study conducted by Astleitner and Zumbach (2023) who argue that gender has a great impact on collegiality in a way that females are more inclined to make relationships with their colleagues.
6 | Conclusion
This study set out to develop a scale to assess EFL teachers' collegiality competence and then investigate the psychometric features of the newly-developed scale. The current study extends previous research on collegiality, especially designing a scale for assessing EFL teachers' collegiality competence. In the absence of any scale assessing teachers' collegiality, it has not been already viable to measure the construct in its operational terms. Consequently, the development of a new scale for assessing collegiality will provide more opportunities for researchers to track and look more deeply at the elements that underlie teachers' collegiality. In fact, the scale is a tool to be used for conceptual and practical research purposes. For example, researchers could examine the role of collegiality in the process of teacher development. The scale can be used in the training of prospective EFL teachers and the encouragement of educators previously in employment for the purpose of professional development. More importantly, the scale will provide a foundation through which researchers can explore EFL teachers' collegiality competence and examine the relationship between their collegiality and other related variables and concepts. Further research on collegiality is crucially needed in order to better understand the elements and factors that promote collegiality competence in different educational contexts. Understanding the factors and/or variables that contribute to collegial co-existence among teachers plays a significant role in teaching behaviors and classroom practices of teachers and can allow teachers to develop more effective strategies to promote their relationships.
As with any research study, the present research has several limitations. The most salient limitation of the study is that the results of this research cannot necessarily be generalized to all EFL contexts, although they can logically be generalized to Iranian EFL teachers. Cultural factors concerning the development and administration of the scale may affect related elements assessed in the scale. Therefore, it is highly suggested that future research take into account cultural factors to develop and validate the scale in a wider international context with different backgrounds and a wide range of understanding work relationships. Another limitation of the study is that the sample used in this research was EFL teachers who teach English in institutes and schools. To gain generalizability, future studies could consider greater diversity and extend the validation with a broader exploration of university teachers and more diverse populations with foreign languages. Finally, or methodological triangulation, further research can be conducted to use qualitative data collection methods along with the scale.
References
Management Journal, 38(3), 839–862. URL:https://www.jstor.org/stable/256748
students? Higher Education of Social Science, 7(1), 26–34. https://doi.org/10.3968/5127
Alleman, N. F., Allen, C. C., & Haviland, D. (2017). Collegiality and the collegium in an era of faculty differentiation.
ASHE Higher Education Report, 43(4), 7–122. https://doi.org/10.1002/aehe.20120
Measurement in Education (NCME). (2014). Standards for educational and psychological testing. AERA.
Andrich, D. (1978). A rating formulation for ordered response categories. Psychometrika, 43(4), 561–573.
https://doi.org/10.1007/BF02293814
model for self-assessment-based educational improvement and quality assurance [Paper presentation]. European
Conference on Educational Research (ECER), Geneva, Switzerland.
https://www.plus.ac.at/wp-content/uploads/2021/04/CiR_AS_ECER21.pdf
orientations contribute to prosocial behavior. Higher Education Research and Development, 42(8), 1840–1854.
https://doi.org/10.1080/07294360.2023.2209515
689. https://doi.org/10.1177/003172170408500909
Routledge.
leadership and teacher self-efficacy. SAGE Open, 13(4), 1–12. https://doi.org/10.1177/21582440231217884
Chiang, C. K., Chapman, H., & Elder, R. (2011). Overcoming challenges to collaboration: Nurse educators' experiences in
curriculum change. The Journal of Nursing Education, 50(1), 27–33. https://doi.org/10.3928/01484834-20101029-04
colleagues, and their work. Teaching and Teacher Education, 27(1), 235–242. https://doi.org/10.1016/j.tate.2010.08.006
Dawson, D. D., Morales, E., McKiernan, E. C., Schimanski, L. A., Niles, M. T., & Alperin, J. P. (2022). The role of
collegiality in academic review, promotion, and tenure. PLoS One, 17(4), 1–17.
https://doi.org/10.1371/journal.pone.0265506
Bakker, & C. C. Maslach (Eds.), Burnout at work: A psychological perspective (pp. 25–35). Taylor & Francis Group.
Ethiopian public universities found in the Amhara region. Heliyon, 9(1), 1–11.
https://doi.org/10.1016/j.heliyon.2023.e12848
Rasch Poisson Counts model. Learning and Individual Differences, 52, 121–128.
https://doi.org/10.1016/j.lindif.2015.01.013
Dörnyei, Z. (2003). Questionnaires in second language research: Construction, administration, and processing.
Lawrence Erlbaum.
questionnaire. European Review of Applied Psychology, 70(4), 1–11. https://doi.org/10.1016/j.erap.2020.100555
Routledge.
Esterhazy, R., de Lange, T., Bastiansen, S., & Wittek, A. L. (2021). Moving beyond peer review of teaching: A conceptual
framework for collegial faculty development. Review of Educational Research, 91(2), 237–271.
https://doi.org/10.3102/0034654321990721
Grünberg, J., & Armellini, A. (2004). Teacher collegiality and electronic communication: A study of the collaborative uses
of email by secondary school teachers in Uruguay. British Journal of Educational Technology, 35(5), 597– 606.
https://doi.org/10.1111/j.0007-1013.2004.00416.x
Hambleton, R. K., & Swaminathan, H. (1985). Item response theory: Principles and applications. Kluwer- Nijhoff.
Han Y., Wei, R., & Wang, J. (2023). An ecological examination of teacher emotions in an EFL context. Frontiers in
Psychology, 14, 1–12. https://doi.org/10.3389/fpsyg.2023.1058046
Hargreaves, A. (1994). The teacher as collaborative learner. Corwin Press.
novice teachers. Teacher Development: An International Journal of Teachers' Professional Development, 5(3), 371–390.
https://doi.org/10.1080/13664530100200150
Hashimoto, H., & Maeda, K. (2021). Collegial organizational climate alleviates Japanese school teachers’ risk for burnout.
Frontiers in Psychology, 12, 1–7. https://doi.org/10.3389/fpsyg.2021.737125
higher education in Western China. Springer.
lesson study: Capturing inputs, processes, and outcomes. International Journal of Educational Research Open, 5, 1–11.
https://doi.org/10.1016/j.ijedro.2023.100272
education (pp. 385–401). Springer.
colleagues. Teachers College Record, 109(9), 2083–2106. https://doi.org/10.1177/016146810710900903
https://doi.org/10.1177/00131610121969316
of inquiry and collegiality. Journal of Research Science Teaching, 42(1), 3–24. https://doi.org/10.1002/tea.20038
Education Today, 114, 1–13. https://doi.org/10.1016/j.nedt.2022.105389
1–8. https://doi.org/10.1016/j.nedt.2022.105388
Transactions, 16(2), 1–99. URL:https://www.rasch.org/rmt/rmt162f.htm
URL:https://www.rasch.org/rmt/rmt183p.htm
Linacre, J. M. (2009a). WINSTEPS Rasch Measurement [Computer program]. Chicago, IL: Winsteps.
Linacre, J. M. (2009b). A user’s guide to WINSTEPS. Chicago, IL: Winsteps.
college major. Health: An Interdisciplinary Journal for the Social Study of Health, Illness and Medicine, 26(4), 475–
494. https://doi.org/10.1177/1363459320967055
Chicago Press Originally published 1960, Pædagogiske Institut, Copenhagen.
Personality Assessment, 84(3), 228–238. https://doi.org/10.1207/s15327752jpa8403_02
Ross, J. A., & Gray, P. (2006). Transformational leadership and teacher commitment to organizational values: The
mediating effects of collective teacher efficacy. School Effectiveness and School Improvement, 17, 179–199.
https://doi.org/10.1080/09243450600565795
Shah, M. (2012). The importance and benefits of teacher collegiality in schools: A literature review. Procedia–
Social and Behavioral Sciences, 46, 1242–1246. https://doi.org/10.1016/j.sbspro.2012.05.282
Shah, M., & Abualrob, M. (2012). Teacher collegiality and teacher professional commitment in public secondary schools
in Islamabad, Pakistan. Procedia - Social and Behavioral Sciences, 46, 950–954.
https://doi.org/10.1016/j.sbspro.2012.05.229
satisfaction and burnout syndrome: What makes difference in Czech elementary schools. Frontiers in Psychology, 10, 1–8.
https://doi.org/10.3389/fpsyg.2019.02287
Stout, W. (1987). A nonparametric approach for assessing latent trait unidimensionality. Psychometrika, 52(4), 589–
617. https://doi.org/10.1007/BF02294821
Tabatabaee-Yazdi, M., Motallebzadeh, K., Ashraf, H., & Baghaei, P. (2017). A latent variable analysis of continuing
professional development constructs using PLS-SEM modeling. Cogent Education, 4(1), 1–15.
https://doi.org/10.1080/2331186X.2017.1355610
strategies: A model for the Iranian EFL teachers’ success. SAGE Open, 8(1). 1–14.
https://doi.org/10.1177/2158244018764234
Yamashita, T. (2022). Analyzing Likert scale surveys with Rasch models. Research Methods in Applied Linguistics, 1(3),
