Full Html
A Rasch Model Analysis of the Persian Translation of the EFL Listening Strategy Inventory
Full Html
1 | Introduction
As one of the main language skills, has not received as much attention as other language skills did. One of the reasons is that “listening comprehension process is internal and thus not subject to direct, external observation, examination, and correction” (Chastain, 1988, p. 192). Hence, its importance tended to be ignored for a long time. A few decades ago the importance of listening skill was finally recognized by language teachers and scholars and listening became one of the key components of many teaching programs. However, it was not still clearly known to teachers how to help learners improve their listening skill. Comparisons of competent and weaker listeners provided insights as to how to help learners develop their listening. From such comparisons, Goh (2005) mentions three features of listening expertise: knowledge, strategies, and control. Research has shown that strategy instruction has a positive effect on listening (Graham & Macaro, 2008; Ngo, 2019; Thompson & Rubin, 1996; Vandergrift, 1999, to name a few). Drawing on O’Malley and Chamot (1990) and Oxford (1990), Goh (2005) broadly defined listening strategies as “conscious procedures for understanding, remembering and recalling information” (p. 72).
One of the ways to go around this feature of listening (unobservable process) and understand the mental processes and strategies learners use while listening is using learner self-ratings in the form of questionnaires. Self-rating is a process through which learners gauge their own abilities usually by choosing one of the options for items on a Likert-type scale. Self-ratings can be used for a variety of purposes. Learners can foster their awareness of their strengths and weaknesses and teachers can use the results of learners’ self-ratings to tailor their teaching methods in order to address learners’ weaknesses.
One of the areas of applied linguistics where questionnaires have become popular instruments for data collection is language learning strategies. Interest in research on language learning strategies increased by Oxford’s (1990) Strategic Inventory for Language Learning (SILL) and O'Malley and Chamot's (1990) tripartite taxonomy (cognitive, metacognitive, and socio-affective). An example is Vandergrift’s (1997) taxonomy of listening strategies in which he proposed a two-level model of listening processes: low-level processes including perception of auditory input and high-level processes including comprehension of information. The early studies on listening strategies, which focused on differences between successful and unsuccessful listeners (e.g. Murphy, 1985; Chamot & Kupper, 1989; O'Malley et al., 1989; Bacon, 1992a, 1992b; Vandergrift, 1996; Vandergrift, 1997), employed think-aloud techniques and to a lesser degree interviews for the purpose of data collection. However, with the growing popularity of self-ratings, they gained increasingly more acceptance for data collection purposes.
Investigations on listening strategies, based on Nix (2016), have produced mixed results. One of the reasons is that such ad hoc instruments are not usually validated, (or at least the validation process is not reported). Therefore, we cannot be certain whether they measure only listening strategies construct. Moreover, due to the use of different listening questionnaires it is hard to compare results across studies. That is, different researchers (e.g., Sawaki & Nissan, 2009; Shirani Bidabadi & Yamat, 2011) have developed/adapted their own version of listening strategy questionnaires and used them in their study, which makes cross-study comparisons difficult. To solve the problem, Nix (2016) developed English as a foreign language (EFL) Listening Strategy Inventory ELLSI which originally had 68 items, of which 23 turned out to fit the Rasch model.
One of the first steps to better understand the construct of listening strategies and gain more conclusive results in relevant studies is to have a valid measure of listening strategies which makes the results of cross cultural studies comparable. This entails translation of the instrument and examining its generalizability to contexts other than the original settings in which it was developed and validated. Hence, for each translation there is a need for construct validity evidence of the instrument in the new language and culture. This study reports the process of translating ELLSI into Persian and investigating the construct validity of its translated version.
2 | Method
2.1 | Translation Procedure
ELLSI questionnaire (Nix, 2016) was originally designed to measure the latent trait listening strategy use of Taiwanese EFL learners. The questionnaire has 23 items and consists of two dimensions: bottom up and top down listening strategies. The original questionnaire was found to enjoy acceptable psychometric properties. The external validity of the questionnaire was examined by correlating responses to the questionnaire and a listening comprehension test. The questionnaire was translated into Persian and used as the main measure in this study.
The questionnaire went through a complicated process of forward and backward translation by a number of translators. The guidelines proposed by the International Test Commission (ITC; 2017) were followed in all stages of the translation. ITC recommends that questionnaires should be translated conceptually rather than literally. In other words, translators should aim at conveying the meaning intended by the original questionnaire not at a word-for-word translation. Moreover, the translation should be concise, clear, and understandable to a broad range of common audience. Finally, issues of age and gender should also be taken into account in the process of translation and jargons should be avoided. In each stage of translating ELLSI, the translators followed these guidelines.
As the first step, it is suggested that the questionnaire should be translated into the target language by two independent translators, one of whom is familiar with the concepts and areas the questionnaire intends to measure and the other is not aware of the purpose for which the questionnaire is going to be employed. The first translator of the questionnaire was the researcher himself and the second one was a colleague of his (holding an MA in teaching English as a foreign language (TEFL)). After the completion of their translation, the two translators met to compare their translations and discussed the differences. The result of their meeting was the production of a consensus questionnaire. Next, the original questionnaire and the translations of the two translators along with the agreed upon translation were sent to two other experts (one translation expert, and one expert holding a PhD in TEFL) to either choose one of the translations or suggest a new translation. None of them suggested a new translation; they just left a few comments. The researcher (first translator) and the second translator applied the comments to the questionnaire. It was then sent for back translation to a third independent translator who was blinded to the original version of ELLSI. Finally, a committee consisting of the first two translators and the back translator compared the source language back-translation and source language original ELLSI. At this step, more weight was given to perceived similarity of meaning than to similarity of form. Based on the comparison of the two English versions of the questionnaire, only minor changes were made to a few items. The final version of the Persian questionnaire can be found in the Appendix.
2.2 | Participants
The Persian translation of the ELLSI was given to 233 Iranian EFL learners. There were 145 (62%) female and 88 (38%) male participants. Their mean age was 16 (SD =3). The participants, who were selected through convenience sampling, were taking general English courses. They were from different proficiency levels, and their course books were Top Notch series (Saslow & Ascher, 2011). They were learning English as a foreign language in a private language institute.
2.3 | Measurement Model
From among a number of different definitions that have been proposed for validity by scholars in the field, Borsboom et al.’s (2004) account is considered as the operationalized definition of validity in this study. They argue that a test needs to meet two conditions to be considered as valid: a construct must exist in reality, and there must be a causal relationship between the levels of the construct and test scores.
As it can be seen in Borsboom et al.’s (2004) definition and also according to Baghaei and Tabatabaee-Yazdi (2016), validity is so closely related to measurement that discussions of validity not preceded by a definition of measurement do not seem to be logical. “… the semantics of validity cannot be separated from the notion of measurement” (Borsboom et al., 2003, p. 328). There are two major measurement theories in psychology: classical test theory (CTT) and latent trait theory. Of these two, the latter is believed to enjoy more precision on the grounds that in CTT true score is only a matter of consistency of scores across different administrations of the instrument not a measure of the construct under investigation. The Rasch model, as a latent trait model, transforms “ordinal person and item raw scores into interval measures which can be located on the same metric” (Baghaei & Cassady, 2014, p. 3). The procedures underlying the Rasch model captures the validity concept as defined by Borsboom et al. (2004). One of the most important analyses done by the Rasch model is that of unidimensionality. If the data fit the model one can be sure that there exists an underlying construct and this construct is the common cause underlying variations in response patterns.
3 | Results
This paper, as mentioned earlier, is the report of an attempt to examine the psychometric properties of the Persian version of EFL Listening Strategy Inventory (PELSI). In so doing we evaluated a) the quality of individual items in PELSI in terms of infit and outfit statistics, b) item and person reliability and separation, c) the quality of the rating scale in differentiating perceived levels of strategy use, d) dimensionality of the scale, e) differential item functioning (DIF) on the basis of gender, and f) person invariance. The questionnaire, which includes 23 items, was administered to a sample of 233 teenage EFL learners. Collected data were then analyzed using WINSTEPS software, version 3.72.3 (Linacre, 2023).
3.1 | Individual Item Characteristics
The local fit, i.e., the quality of individual items, was examined by checking the contribution of each item to the underlying construct. To this end, infit and outfit mean squares (MNSQ) are indicative of whether individual items fit the Rasch model. Infit is considered as a better fit statistic since it is not sensitive to outliers (Linacre, 2023). Though expected infit value is 1 for polytomous items, values between 0.60 and 1.4 are acceptable (Linacre, 1999; Wright & Linacre, 1994). Based on Wright and Linacre (1994), infit values over 1.4 are a sign of multidimensionality and those under 0.60 are too good to be acceptable and redundant.
The results of individual item measures and fit statistics are presented in Table 1. Item 18, with an estimated difficulty level of 1.4 logits and a standard error of 0.07 was the most difficult item, and Item 2 with a difficulty measure of -0.97 logits and a standard error of 0.09 was the easiest one. Checking fit values of the items suggests that Items 12 and 17 with infit MNSQ values of 1.51 and 1.50, respectively, should be considered for revision or deletion. Checking the content of these items and considering their slight difference from the acceptable value of 1.4, we decided to keep these two items.
Table 1
Item Measures and Fit Statistics for PELSI
Item | Total Score | Total Count | Measure | Model S.E. | Infit MNSQ | Outfit MNSQ |
1 | 964 | 230 | -0.66 | 0.09 | 1.06 | 1.23 |
2 | 1015 | 233 | -0.97 | 0.09 | 1.18 | 1.13 |
3 | 917 | 232 | -0.31 | 0.08 | 0.81 | 0.85 |
4 | 648 | 232 | 0.99 | 0.07 | 0.83 | 0.87 |
5 | 781 | 231 | 0.38 | 0.07 | 0.87 | 0.87 |
6 | 814 | 228 | 0.18 | 0.07 | 0.81 | 0.81 |
7 | 831 | 233 | 0.18 | 0.07 | 0.80 | 0.79 |
8 | 912 | 233 | -0.25 | 0.08 | 1.04 | 0.99 |
9 | 790 | 233 | 0.37 | 0.07 | 1.02 | 1.02 |
10 | 926 | 233 | -0.33 | 0.08 | 0.99 | 0.90 |
11 | 943 | 233 | -0.44 | 0.08 | 0.92 | 0.92 |
12 | 834 | 232 | 0.14 | 0.07 | 1.51 | 1.55 |
13 | 928 | 232 | -0.37 | 0.08 | 1.20 | 1.17 |
14 | 826 | 231 | 0.16 | 0.07 | 0.80 | 0.79 |
15 | 910 | 231 | -0.29 | 0.08 | 1.05 | 1.02 |
16 | 799 | 230 | 0.28 | 0.07 | 1.03 | 1.03 |
17 | 910 | 227 | -0.38 | 0.08 | 1.50 | 1.58 |
18 | 635 | 231 | 1.04 | 0.07 | 1.11 | 1.14 |
19 | 760 | 228 | 0.43 | 0.07 | 0.96 | 0.99 |
20 | 816 | 229 | 0.18 | 0.07 | 0.97 | 0.97 |
21 | 817 | 230 | 0.19 | 0.07 | 0.91 | 0.93 |
22 | 885 | 232 | -0.12 | 0.07 | 0.99 | 0.95 |
23 | 934 | 232 | -0.41 | 0.08 | 1.00 | 0.93 |
Mean | 852 | 231.1 | 0.00 | 0.07 | 1.01 | 1.02 |
SD | 92.1 | 1.8 | 0.47 | 0.01 | 0.19 | 0.20 |
Note. SD = Standard Deviation; S.E. = Standard Error of Measurement; MNSQ = Mean Square
3.2 | Examination of Unidimensionality for PELSI
According to Smith and Plackner (2009), fit statistics for individual items are “relatively insensitive to systematic threats to unidimensionality” (p. 424). Hence, global fit, i.e., the fit of the whole scale to the Rasch model, is evaluated for more rigorous examination of dimensionality. This is done through the investigation of the residuals. “Residuals are differences between predictions of the Rasch model and the actual observations. The smaller the residuals, the better the data tend to fit the model—or the better the model has accounted for the variance in the data” (Baghaei & Cassady, 2014, p. 5). In other words, residuals are the part of data that are left when variance resulting from the common cause is accounted for. To achieve unidimensionality, residuals must be uncorrelated. This is tested using PCA of standardized residuals. If the magnitudes of the eigenvalues are bigger than the critical value of two, this is evidence of the existence of constructs other than that the researcher is interested in (Linacre, 2023).
The results of PCA of standardized residuals showed that 34% of the variance is explained by the measures and 66% is unexplained variance. Of the 34% variance explained by the measures 10.7 is accounted for by persons and 23.4 by items. There was only one contrast with an eigenvalue (2.3) exceeding the critical value (2). This means that there are more than two items in the scale to form a secondary dimension. To find out which items are loading on this off-target construct, table of loadings on the first contrast (Table 2) was checked.
Loading values beyond ± 0.40 are usually examined (Bond & Fox, 2015). Since positively loading items had higher values we prioritized examining them to examining negatively loading items. The first three positively loading items in a descending order of difficulty (Items 5, 6, and 7) had values bigger than 0.40. These items are:
Item 5: I guess the meaning of unknown words by noticing the gestures, actions, or facial expressions of the speaker.
Item 6: I guess the speaker's attitude toward the topic of discussion by noticing redundant words or phrases with similar meaning.
Item 7: I guess the speaker's intentions by noticing the gestures, actions, or facial expressions of the speaker.
By deleting only Item 5 (which had the highest loading) and rerunning PCA, the eigenvalues of the first contrast reduced to 2. Therefore, we decided to go further and omit the next highly loading item. By deleting Item 6, the eigenvalue of the first contrast became acceptable (1.9). Checking the content of Item 7, which is the third highly loading item, reveals that it is closely related to Item 5. As a result, we decided to delete this item too and run PCA again. The eigenvalue reached the critical value of 2 again, which we decided to tolerate. These three items load on a secondary factor which is related to guessing the meaning of words and attitudes of speakers especially when listening is accompanied by a visual component. It is worth mentioning that deleting these three items resulted in minor changes in individual item statistics in a way that Items 12 and 17, which previously exceeded critical fit values, fitted the model.
Table 2
Standardized Residual Loadings of Items on the First Factor
Item | Loading | Item | Loading |
1 | -0.28 | 2 | 0.11 |
8 | -0.10 | 3 | 0.37 |
9 | -0.14 | 4 | 0.28 |
10 | -0.10 | 5 | 0.65 |
11 | -0.14 | 6 | 0.58 |
14 | -0.29 | 7 | 0.54 |
16 | -0.09 | 12 | 0.13 |
18 | -0.29 | 13 | 0.24 |
19 | -0.56 | 15 | 0.16 |
20 | -0.15 | 17 | 0.00 |
21 | -0.24 | ||
22 | -0.30 | ||
23 | -0.31 |
3.3 | Response Scale Analysis
After making sure of both local and global fit of the PELSI-20, properties of response categories were examined. Category statistics for the 5-point scale are depicted in Table 3. As shown in the first column, Categories 4 and 5 have been endorsed by far more than the other three categories. This indicates high levels of listening strategy use. In the second column, observed averages for the persons who have endorsed each category have been reported. In well-functioning categories, values in this column follow a growing trend (Bond & Fox, 2015), which is the case for the categories of this scale. The average of infit and outfit mean squares related to each of the response options is reported in the third column. The values are acceptable (below 1.50). The most important column is thresholds. Thresholds show the points where neighboring categories have equal probability of being endorsed. An increasing pattern in the values of the thresholds is expected (Bond & Fox, 2015). The values shown in Table 3 indicate that the options represent a steady growth in level of difficulty. It means that the participants could distinguish among the difficulty levels of the options. Bond and Fox (2015) recommend collapsing disordered adjacent categories, which was not needed for the categories of this scale.
Table 3
Category Statistics for PELSI-20
Count (%) | Observed average | Infit MNSQ | Outfit MNSQ | Threshold | Category |
206 (4) | -0.26 | 1.10 | 1.25 | - | 1 |
505 (11) | 0.06 | 0.99 | 1.02 | -1.04 | 2 |
997 (22) | 0.41 | 0.95 | 0.92 | -0.44 | 3 |
1618 (35) | 0.83 | 0.98 | 0.97 | 0.15 | 4 |
1298 (28) | 1.42 | 0.99 | 1.00 | 1.33 | 5 |
Note. MNSQ = Mean Square
3.4 | Reliability and Separation for Items and Persons
Reliability in Rasch measurement is similar to Cronbach’s α in CTT with the difference that in CTT reliability is computed only for items but Rasch model yields reliability values for both items and persons. Low person separation is defined as separation < 2, person reliability < 0.8 (Linacre, 2023). Person separation index indicates whether the instrument is sensitive enough to distinguish between high ability and low ability participants. Examining person statistics revealed a separation value of 2.24, and a separation reliability of 0.83, which are both acceptable. It means that the order of persons is replicable if we give them a parallel sample of the items (Linacre, 2023).
“Item separation is used to verify the item hierarchy” (Yang et al., 2023). Item separation values < 3 (high, medium, and low item difficulties) and item reliability < 0.9 are considered low. A low item separation means that the number of persons is not enough to verify a reliable hierarchy of items based on their difficulty (construct validity). Item separation and reliability values for PELSI were found to be 6.24 and 0.97, respectively, both of which are bigger than the acceptable threshold values. This means that the order of difficulty of items remains constant if we submit it to a similar sample. Item separation of 6.24 suggests that there are at least six levels of item difficulty.
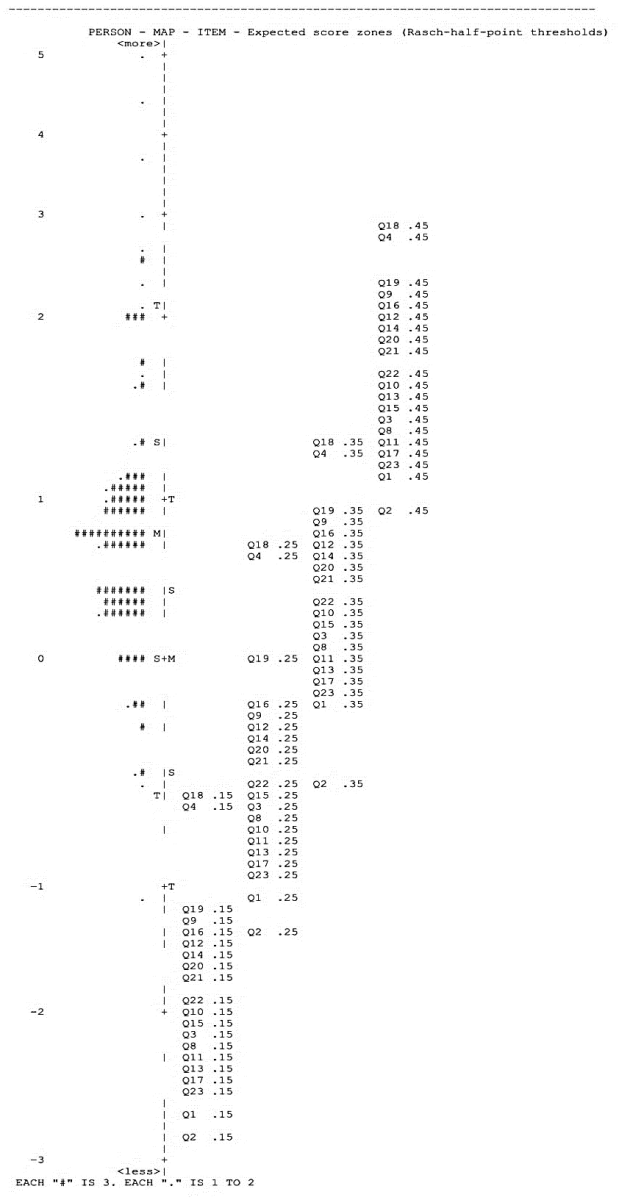
3.5 | Wright Map
One of the properties of the Rasch model is that it provides estimates of item difficulty and person ability on the same ruler. This can be easily depicted on the Wright Map. The distribution of items and their difficulty levels along with threshold estimates are on the right side of the map and person ability levels on the left side of the map. As we move towards the top of the map, item endorsability decreases, i.e., items become harder. In a similar vein, persons towards the top of the map use listening strategies more frequently (more proficient). Including difficulty levels of categories in defining item estimates results in a wider range of difficulty. A cross comparison of values of items measuring the highest and lowest levels of strategy use makes this evident. In Table 1, the value for the hardest item, 18, and the easiest item, 2, are 1.4 and -0.97 logits, respectively. The difficulty range for these items when threshold estimates are included increase. As shown in Figure 1, the values for Item 2 approximates -3 logits and the value for Item 18 is almost 3 logits. Having said these, a closer examination of the extreme ends of the Wright Map shows that there are a number of persons in the upper part of the map whose ability cannot be measured precisely since there are not items with difficulty levels corresponding to those persons’ ability levels. Therefore, adding some items which measure higher levels of listening strategy use improves the instrument.
Figure 1
Wright Map of the Distribution of Persons and Items along with the Threshold Levels on the Latent Variable
3.6 | Invariance Screening
One of the important differences between the CTT and the Rasch model is that the latter enjoys qualities which the former does not. These include person-free instrument calibration and instrument-free person measurement (Wright, 1967). These assumptions are usually examined in Rasch model in terms of item invariance and person invariance.
3.6.1 | Item Invariance
Item invariance refers to the consistent order of item difficulty levels obtained from administration of the instrument across different samples of persons. Differential item functioning (DIF) is usually used to examine item invariance. In DIF, persons are divided into two groups and estimates of item difficulty obtained from the two groups are compared (Bond & Fox, 2015). Some of the criteria to split persons into two groups are gender, age (group), and ability level. In this study we ran DIF for gender. The results of the analyses are presented in Table 4.
DIF contrast values above 0.5 are considered problematic. In case of DIF for gender, values beyond 0.5 are indicative of gender bias, that is, females and males perform differently on such items. The results presented in Table 4 show no signs of DIF, meaning that the assumption of person invariance holds for the items of this scale.
Table 4
Results of DIF for Gender
Item | Person Class | DIF Measure | DIF S.E. | Person Class | DIF Measure | DIF S.E. | DIF Contrast | Joint S.E. | Probability |
1 | 1 | -0.66 | 0.11 | 2 | -0.63 | 0.14 | -0.03 | 0.17 | 0.86 |
2 | 1 | -1.05 | 0.12 | 2 | -0.83 | 0.14 | -0.22 | 0.19 | 0.24 |
3 | 1 | -0.39 | 0.10 | 2 | -0.17 | 0.12 | -0.23 | 0.16 | 0.15 |
4 | 1 | 1.07 | 0.08 | 2 | 0.86 | 0.11 | 0.21 | 0.14 | 0.13 |
5 | 1 | 0.26 | 0.09 | 2 | 0.58 | 0.11 | -0.33 | 0.14 | 0.02 |
6 | 1 | 0.15 | 0.09 | 2 | 0.25 | 0.12 | -0.10 | 0.15 | 0.48 |
7 | 1 | 0.09 | 0.09 | 2 | 0.32 | 0.11 | -0.24 | 0.14 | 0.10 |
8 | 1 | -0.16 | 0.09 | 2 | -0.42 | 0.13 | 0.26 | 0.16 | 0.10 |
9 | 1 | 0.41 | 0.09 | 2 | 0.31 | 0.11 | 0.10 | 0.14 | 0.50 |
10 | 1 | -0.20 | 0.09 | 2 | -0.57 | 0.13 | 0.37 | 0.16 | 0.02 |
11 | 1 | -0.38 | 0.10 | 2 | -0.54 | 0.13 | 0.16 | 0.17 | 0.34 |
12 | 1 | 0.21 | 0.09 | 2 | 0.02 | 0.12 | 0.19 | 0.15 | 0.20 |
13 | 1 | -0.34 | 0.10 | 2 | -0.42 | 0.13 | 0.08 | 0.16 | 0.62 |
14 | 1 | 0.19 | 0.09 | 2 | 0.12 | 0.12 | 0.08 | 0.15 | 0.61 |
15 | 1 | -0.46 | 0.10 | 2 | -0.02 | 0.12 | -0.44 | 0.16 | 0.00 |
16 | 1 | 0.28 | 0.09 | 2 | 0.28 | 0.11 | 0.00 | 0.14 | 1.00 |
17 | 1 | -0.49 | 0.10 | 2 | -0.20 | 0.13 | -0.30 | 0.16 | 0.07 |
18 | 1 | 1.00 | 0.08 | 2 | 1.12 | 0.11 | -0.12 | 0.14 | 0.37 |
19 | 1 | 0.52 | 0.09 | 2 | 0.27 | 0.11 | 0.26 | 0.14 | 0.07 |
20 | 1 | 0.26 | 0.09 | 2 | 0.04 | 0.12 | 0.22 | 0.15 | 0.14 |
21 | 1 | 0.19 | 0.09 | 2 | 0.19 | 0.12 | 0.00 | 0.15 | 1.00 |
22 | 1 | -0.18 | 0.09 | 2 | -0.02 | 0.12 | -0.16 | 0.15 | 0.29 |
23 | 1 | -0.33 | 0.10 | 2 | -0.54 | 0.13 | 0.21 | 0.17 | 0.20 |
Note. DIF = Differential Item Functioning; S.E. = Standard Error of Measurement
3.6.2 | Person Invariance
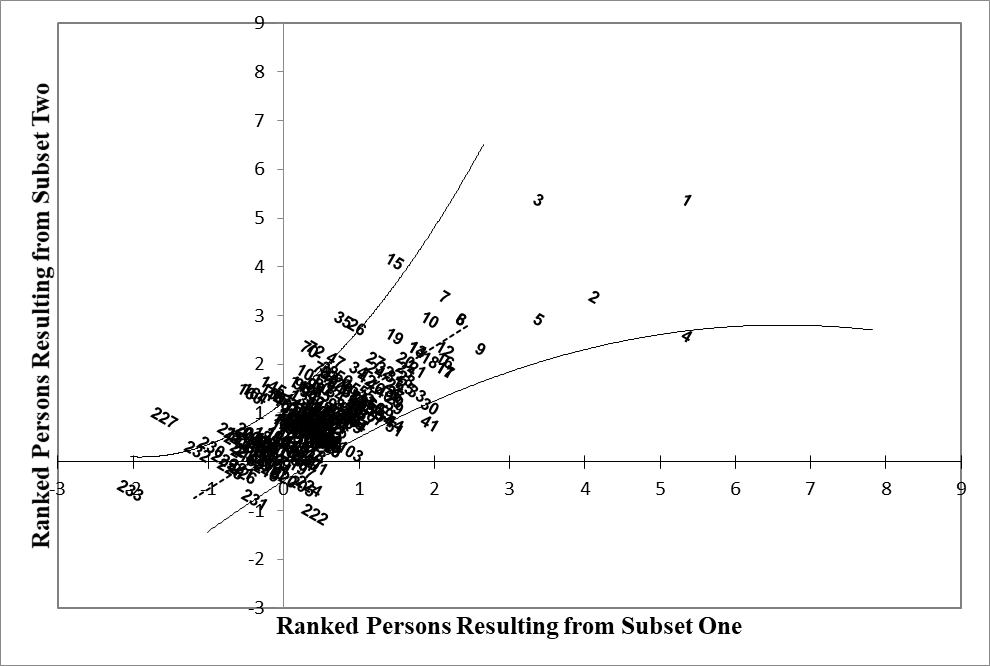
Person invariance occurs when different subsets of items from the scale result in similar person parameters. In other words, different samples from the same pool of items yield similar person ability parameters. If this assumption is met, we have instrument-free person measurement. Different criteria have been used to divide items into two halves. For example, Wright (1967) split the items based on their difficulty index, i.e., easy items were put in one group and difficult items in another. In the current study, we put negatively loading items (from PCA of standardized residuals) on the first construct in one group and positively loading ones in another. Then we cross-plotted person abilities resulting from these two subsets on X and Y axes. The results are presented in Figure 2.
Figure 2
Person Parameters from Subset One Cross Plotted against Person Parameters from Subset Two
4 | Discussion
In the realm of listening, a proliferation of studies has exposed the role of listening strategies. Being one of the main features of listening comprehension competence, listening strategies may serve as a starting point to help learners boost their listening ability (Goh, 2005). Listening strategy use is one of the factors which distinguish proficient listeners from weaker ones (Goh, 2005). Hence, strategy training is one way to help learners overcome their weaknesses. One of the techniques used to gauge learners’ use of strategies is self-rating, the results of which can be used to tailor teaching to learners’ needs. One of the problems in listening strategy research, which is claimed to be a source of inconclusive findings (Nix, 2016), is dependence on questionnaires which have not gone through the process of validation. For the purpose of cross cultural studies, questionnaires which enjoy acceptable construct validity measures must be constructed.
The aim of this research was to scrutinize the psychometric properties of the Persian translation of ELLSI. The translation procedure included forward and backward translation and was done according to the guidelines proposed by the ITC (2017). To examine construct validity of the translated version, the rating scale model (Andrich, 1978) was employed. In the Rasch model, construct validity is evaluated by comparing the fit of data to the assumptions of the model. Fit of data to the model indicates that items in a questionnaire measure a single underlying construct. Application of the Rasch model to the data suggested that the original 23-item ELLSI translated into Persian did not work reasonably in assessing listening strategies. Three items, namely items 6, 7, and 8, were found to be forming a secondary dimension. Omitting these items resulted in PELSI-20 which enjoys acceptable psychometric properties and can be safely used to measure the latent trait of listening strategy use in the Iranian milieu. Response categories were also examined. They showed an acceptable growing level of difficulty. Reliability and separation statistics suggested that items in PELSI-20 fall into six levels of difficulty and the order of item difficulty is replicable with another similar sample. It also distinguishes between at least two ability levels for the participants and a similar set of items will yield similar order ability level. Finally, item and person invariance were examined by examining DIF for gender and cross plotting learner abilities yielded by two subsets of the items from the questionnaire. The results of invariance screening for both persons and items were acceptable.
Although PELSI-20 passed the validation test, there are two limitations that can be addressed by future research. First, the majority of the participants in this study were teenagers. Hence, one of the points that research in future may take into account is administering PELSI-20 to adult learners of English and examine person invariance across different age groups. Second, the participants who took part in this study were monolinguals and (besides English) spoke only Persian (Farsi) while only 50 percent of Iranian population is only monolingual (Lewis et al., 2015). The other half of people come from different ethnic groups and speak at least two languages, of which Persian is usually not their first language. Research has shown that the type and number of previous languages a person knows might exert influence on their patterns of strategy use (e.g., Afsharrad & Sadeghi Benis, 2017). A replication of this study with Iranian learners of English from different language backgrounds and ethnic groups will add to the validity of this instrument. We hope that future research takes the aforementioned points into account and improves PELSI-20 so that it can be used with more certainty across different contexts in Iran.
References
Bilingualism, 20(1), 34–51. https://doi.org/10.1080/13670050.2015.1037238
Andrich, D. (1978). A rating formulation for ordered response categories. Psychometrika, 43(4), 561–573.
https://doi.org/10.1007/BF02293814
response in foreign language listening. The Modern Language Journal, 76(2), 160–178.
https://doi.org/10.1111/j.1540-4781.1992.tb01096.x
25(4), 317–334. https://doi.org/10.1111/j.1944-9720.1992.tb00552.x
Retrieved from www.rasch.org/rmt/rmt221a.htm
1–11. https://doi.org/10.1177/2158244014555113
measurement. The Open Psychology Journal, 9, 168–175. https://doi.org/10.2174/1874350101609010168
Borsboom, D., van Heerden, J., & Mellenbergh, G. J. (2003). Validity and truth. In H. Yanai, A. Okada, K. Shingemasu, Y.
Borsboom, D., Mellenbergh, G. J, & van Heerden, J. (2004). The concept of validity. Psychological Review, 111(4),
1061–1071. http://dx.doi.org/10.1037/0033-295X.111.4.1061
13–24. https://doi.org/10.1111/j.1944-9720.1989.tb03138.x
Chastain, K. (1988). Developing second-language skills: Theory and practice. Harcourt Brace Jovanovich Inc.
teaching (pp. 64–84). Palgrave Macmillan.
Learning, 58(4), 747–783. https://doi.org/10.1111/j.1467-9922.2008.00478.x
URL:http://jampress.org/jom.htm
Linacre, J. M. (2023). A user’s guide to WINSTEPS. Chicago, IL: Winsteps.
Murphy, J. M. (1985, April 8–14). An investigation into the listening strategies of ESL college students [Paper
Presentation]. Annual Meeting of the Teachers of English to Speakers of Other Languages, New York, NY, United
States. URL:https://eric.ed.gov/?id=ED278275
perspective. System, 81, 63–77. https://doi.org/10.1016/j.system.2019.01.002
inventory. System, 57, 79–97. https://doi.org/10.1016/j.system.2016.02.001
O'Malley, J. M., & Chamot, A. U. (1990). Learning strategies in second language acquisition. Cambridge University Press.
O’Malley, J. M., Chamot, A. U., & Kupper, L. (1989). Listening comprehension strategies in second language acquisition.
Applied Linguistics, 10(4), 418–437. https://doi.org/10.1093/applin/10.4.418
Oxford, R. L. (1990). Language learning strategies: What every teacher should know. Heinle.
Saslow, J., & Ascher, A. (2011). Top Notch Fundamentals (2nd Ed.). Pearson Education.
university students and their listening proficiency levels. English Language Teaching, 4(1), 26–32.
https://doi.org/10.5539/elt.v4n1p26
Measurement, 10(4), 424–437. URL:http://jampress.org/abst2009.htm
Annals, 29(3), 331–342. https://doi.org/10.1111/j.1944-9720.1996.tb01246.x
52(2), 200–223. https://doi.org/10.3138/cmlr.52.2.200
Language Annals, 30(3), 387–409. https://doi.org/10.1111/j.1944-9720.1997.tb02362.x
Journal, 53(3), 168–176. https://doi.org/10.1093/elt/53.3.168
Conference on Testing (pp. 85–101). ETS.
